

Now that we have a comprehensive overview of the capabilities and functionalities of Matplotlib, we are ready to get our hands dirty and work through some examples. We will begin after ensuring that we have set up the Matplotlib environment. Follow along the steps discussed to set up the environment.
Since version 2.0, Matplotlib supports both Python 2.7 and 3.4+. We are using Python 3 in this book, which is the latest stable Python version. You can download Python from http://www.python.org/download/.
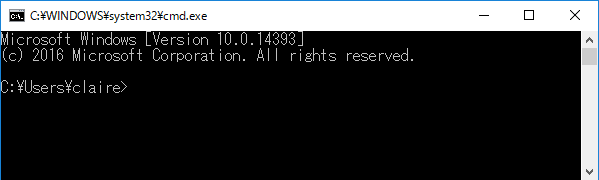
Python comes as an installer or zipped source code for Windows. We recommend the executable installer. Choose the right computer architecture for the best performance. You can call Python in the Command Prompt by pressing the Windows + R keys and typing cmd.exe, as shown in the following screenshot:
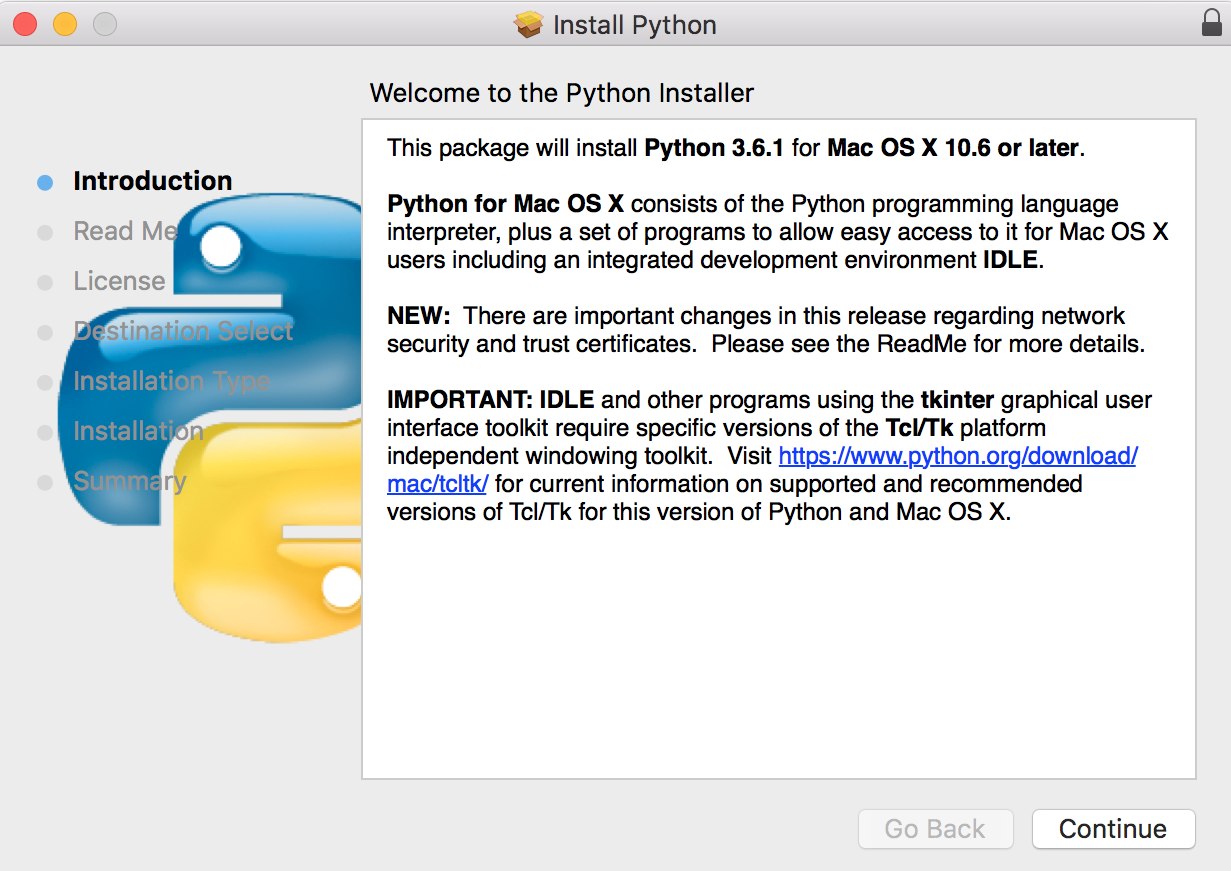
macOS natively comes with Python 2.7. To install Python 3.4+, download the installation wizard and follow the instructions. Following is a screenshot of the wizard at the first step:
Most Linux distributions have Python 3.4 preinstalled. You may confirm this by typing python3 in the Terminal. If you see the following, it means Python 3.4 is present:
Python3.6.3 (default, Oct 62017, 08:44:35) [GCC 5.4.0 20160609] on linux Type "help", "copyright", "credits" or "license"for more information. >>>
If the Python shell does not appear at the command, you can install Python 3 with apt, the Linux software management tool:
sudo apt update
sudo apt install Python3 build-essential
The build-essential package contains compilers that are useful for building non-pure Python packages. Meanwhile, you may need to substitute apt with apt-get if you have Ubuntu 14.04 or older.
Matplotlib requires a large number of dependencies. We recommend installing Matplotlib by a Python package manager, which will help you to automatically resolve and install dependencies upon each installation or upgrade of a package. We will demonstrate how to install Matplotlib with pip.
Matplotlib depends on a host of Python packages for background calculation, graphic rendering, interaction, and more. They are NumPy, libpng, and FreeType, and so on. Depending on the usage, users can install additional backend packages, such as PyQt5, for a better user interface.
We recommend installing Matplotlib using the Python package manager pip; it resolves basic dependencies automatically. pip is installed with Python 2 >= 2.7.9 or Python 3 >= 3.4 binaries.
If pip is not installed, you may do so by downloading get-pip.py from http://bootstrap.pypa.io/get-pip.py, and running it in the console:
python3 get-pip.py
To upgrade pip to the latest version, do this:
pip3 install --upgrade pip
The documentation for pip can be found at http://pip.pypa.io.
To create our plots, we need a user-friendly development environment.
Jupyter Notebook provides an interactive coding ground to edit and run your code, display the results, and document them neatly. Data and methods can be loaded to the memory for reuse within a session. As each notebook is hosted as a web server, you can connect to notebook instances running at a remote server on a browser.
If you are excited to try it out before installing, you may go to https://try.jupyter.org and open a Python 3 notebook.
To install Jupyter, type this in your console:
python3 -m pip install jupyter
Just type jupyter notebook in the console. This will start a Jupyter Notebook session as a web server.
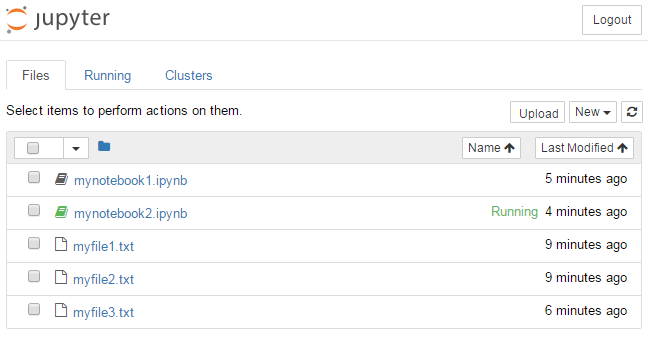
By default, a notebook session should pop up on your default browser. To manually open the page, type localhost:8888 as the URL. Then you will enter the following home page of the Jupyter Notebook:
You can choose to host the notebook on different ports, for instance, when you are running multiple notebooks. You can specify the port to use with the --port=<customportnum> option.
Since the release of 4.3, token authentication has been added to Jupyter, so you may be asked for a token password before entering the notebook home page, as shown in the following screenshot:
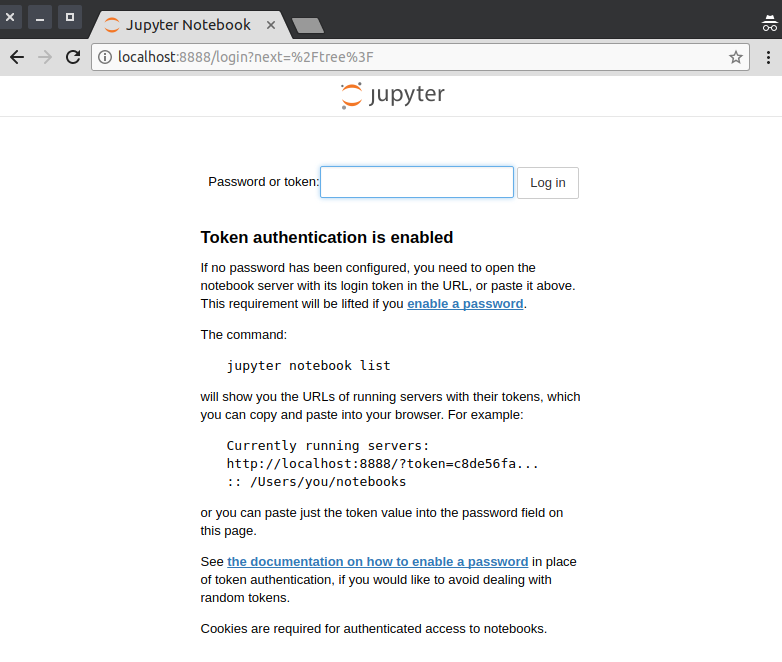
To retrieve the token, such as when visiting the running notebook from a different browser or machine, you may call jupyter notebook list from the console:

To open a notebook running on a remote server, you may set up port forwarding during SSH, as follows:
ssh –L 8888:localhost:8888 mary@remoteserver
Then you may open the notebook again with localhost:8888 as the URL.
Note
When multiple users are running Jupyter Notebooks on the same server on the same port (say the default, 8888) and each uses the same port forwarding, there is a possibility that your notebook content will be forwarded to another user who cannot read his/her own content without changing the port. While this might be fixed with later releases, it is recommended to change the port from the default.
To upgrade from a previous version, run the following command:
pip3 install --upgrade matplotlib
pip will automatically collect and install the Matplotlib dependencies for you.
A Jupyter Notebook has boxes called cells. It begins with the text input area for code editing, known as the gray box cell, by default. To insert and edit the code do the following:
- Click inside the gray box.
- Type your Python code inside it.
- Click on the play button or press Shift + Enter to run the current cell and move the cursor to the next cell:
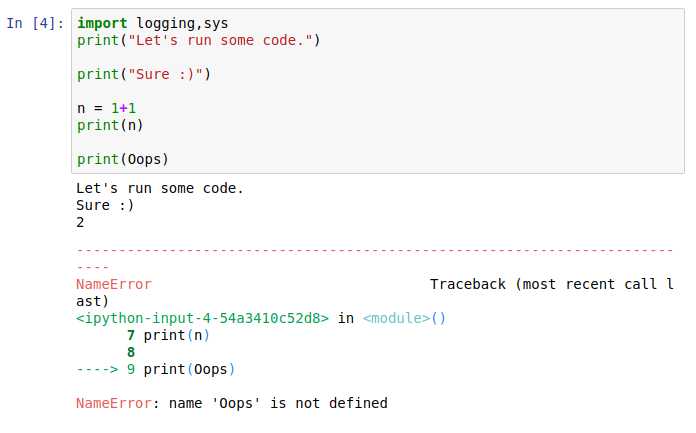
Once a cell is run, the relevant data and methods are loaded to the memory and can be used across cells in the same notebook kernel. No reloading is needed unless for an intended change. This saves effort and time in debugging and reloading large datasets.
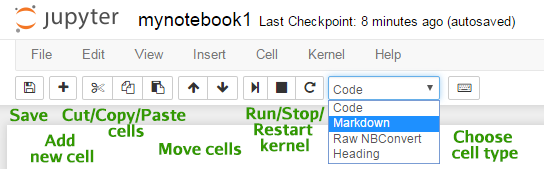
You can use the toolbar at the top to manipulate cells and the kernel. The available functions are annotated as follows:
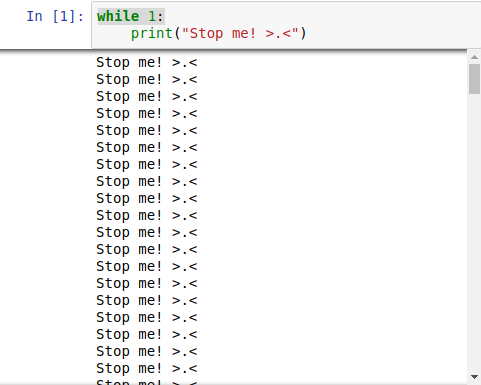
Verify your output amount before running a cell! A huge output stream doesn't usually kill your console, but it can easily crash your browser and notebook in a matter of seconds. This issue has been addressed since Jupyter 4.2 by stopping large output. However, it does not guarantee to capture all non-stop output. Therefore, readers are advised to exercise caution and avoid attempts to obtain large output results in a notebook cell. Consider slicing it for a glimpse or obtaining output in another file:
Matplotlib is highly integrated into Jupyter Notebook. Use the Jupyter built-in magic command %matplotlib inline (set as default in the current release) to display resultant plots as static image output at each cell:
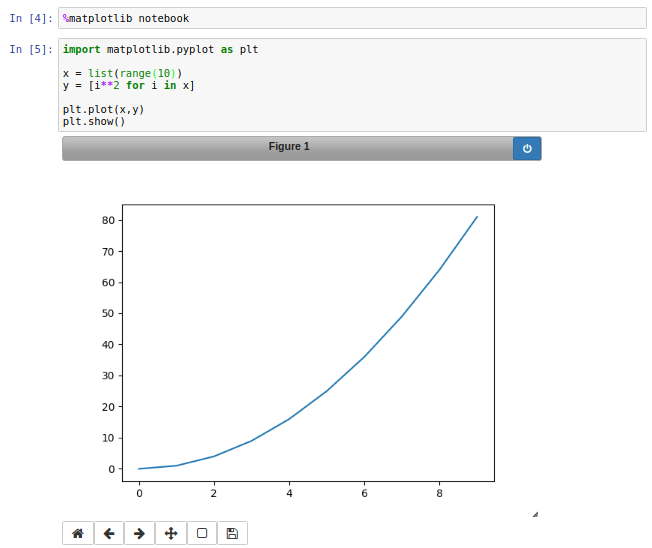
Alternatively, you can run a magic cell command—%matplotlib notebook to use the interactive Matplotlib GUI for zooming or rotating in the same output area:

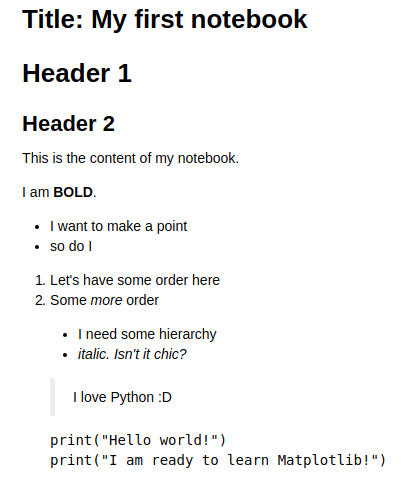
Jupyter Notebook supports Markdown syntax for organized documentation:
- Select
Markdownfrom the drop-down list in the toolbar. - Write your notes in the gray input box.
- Click on
Runor Shift + Enter:
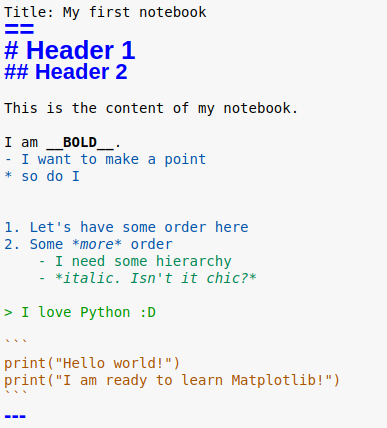
After running the cell, the text will be styled in the display:
You can find a detailed Markdown cheat sheet by Adam Pritchard at https://github.com/adam-p/markdown-here/wiki/Markdown-Cheatsheet.
Jupyter Notebook auto-saves itself every 2 minutes. As good practice, you should save it yourself more often by clicking on the floppy icon on the toolbar, or more conveniently by Ctrl + S.
Each project you open on Jupyter is saved as the JSON-based .ipynb notebook format:
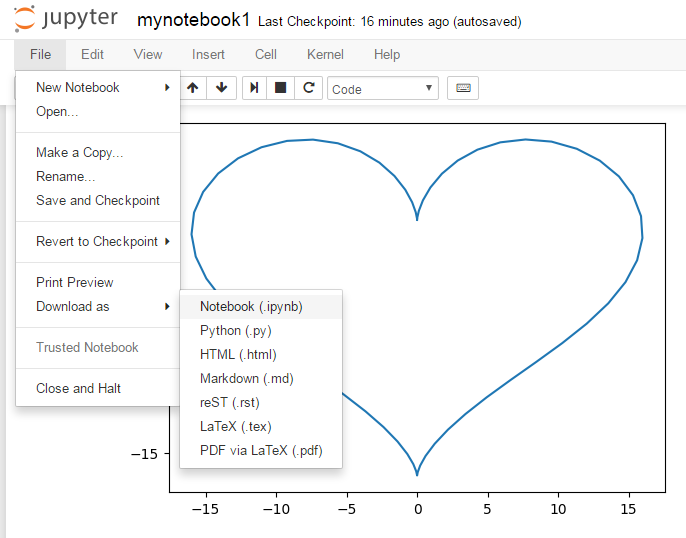
The .ipynb notebook is portable across different Jupyter servers. Notebooks can be exported as basic runnable Python script .py, Markdown .md for documentation, and web page format .html for instant display of the flow of your project without having the readers install Jupyter Notebook in advance. It also supports LaTex format and PDF conversion via LaTex upon installation of the dependency Pandoc. If interested, you may check out the installation instructions at http://pandoc.org/installing.html.