Reader small image

You're reading from  Kibana 8.x – A Quick Start Guide to Data Analysis

Product typeBook
Published inFeb 2024
PublisherPackt
ISBN-139781803232164
Edition1st Edition
Right arrow
Author (1)
Krishna Shah
Krishna Shah
author image
Krishna Shah

Krishna Shah is a data architect from Melbourne, Australia with 9+ years of experience, and she knows how to make data work. She's been an official trainer for Elasticsearch and Kibana, crafting the courses that empower people to unlock the secrets of data. Prior to that, she worked for a start-up in India as the data engineer behind building and maintaining data engineering pipelines, then transforming that raw information into stunning visuals and insights using Kibana and other data engineering technologies. Today, she's an advocate, a mentor, and a bridge-builder, inviting everyone to find their own rhythm in the data's dance. Whether you're a novice or seasoned analyst, brace yourself for her infectious enthusiasm and knack for making the driest of datasets sing!
Read more about Krishna Shah

Right arrow

Discovering the Data through Discover

So, you’ve got your data in. Now it’s time to answer questions. What countries in the world have the maximum number of people working in IT? What events have the runtime error 404? Which customers are making the highest contribution to the profit?

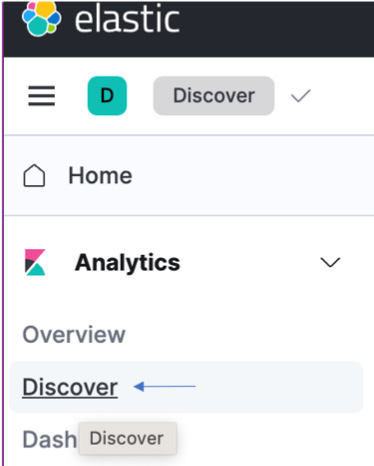
All of these questions (and more!) can be discovered right on this interface. It is finally time to start exploring our dataset through the very interesting interface in Kibana, called Discover. Right when you start collecting and ingesting your data from your data sources, Discover in Kibana will be one place you would like to go and kickstart your exploration of the dataset. From which fields are coming in to how your data is structured with respect to the datatypes of the fields, everything can be visible in Discover. It also has an amazing query feature, which serves as your own custom search functionality placed over whatever dataset you have in the Elasticsearch cluster.

In...

Exploring your data

Let us now start looking into how the data gets stored in the Elasticsearch cluster, which takes us to the concept of a document. Anything that we ingest in the cluster gets stored in the cluster as a document.

Elasticsearch – a document store

Before starting to understand how exploration of data can be done, Elasticsearch is called a distributed document store as it stores the data in the form of serialized JSON documents:

Figure 3.1 – An index with a collection of documents can be stored in Elasticsearch

Figure 3.1 – An index with a collection of documents can be stored in Elasticsearch

These JSON documents are distributed across all the nodes of the cluster. If we go into where this document is stored in an index, it would be a logical namespace called an Index. It can be thought of as a collection of JSON documents that has data stored in the form of key-value pairs that contain the data. See the following example:

 Figure 3.2 – A sample of a record of data

Figure 3.2 – A sample of a record of data

...

Working with queries

Imagine a world where a famous e-commerce website that you wish to shop from doesn’t have a search bar! It is next to inevitable to have a feature to search, which in turn allows a user to type and do a quick look-up on the data. The constant need to search is increasing now, more than ever. In fact, every website, page, or frontend requires a search bar that facilitates the way a user can search the data:

Figure 3.6 – The Search bar

Figure 3.6 – The Search bar

Let’s start understanding the query language that is provided in the search bar of Discover.

Structuring KQL query (example)

Kibana Query Language, abbreviated as KQL, is a text-based query language that is used to filter data in Kibana. It works on a simple syntax of just searching for the terms we’re looking for in the search bar, or being more specific on what we’re searching for by providing a field against the word, shown as follows:

"field": ...

Summary

In this chapter, we studied how to explore different search features to create a query language syntax that can filter our data and show us the results in Discover. We can play around with this UI to leverage the features as needed.

Next up, we shall explore how we can draw distinct types of visualizations in Kibana based on the data in an Elasticsearch cluster.

lock icon
The rest of the chapter is locked
You have been reading a chapter from
Kibana 8.x – A Quick Start Guide to Data Analysis
Published in: Feb 2024Publisher: PacktISBN-13: 9781803232164
Register for a free Packt account to unlock a world of extra content!
A free Packt account unlocks extra newsletters, articles, discounted offers, and much more. Start advancing your knowledge today.
undefined
Unlock this book and the full library FREE for 7 days
Get unlimited access to 7000+ expert-authored eBooks and videos courses covering every tech area you can think of
Renews at $15.99/month. Cancel anytime

Author (1)

author image
Krishna Shah

Krishna Shah is a data architect from Melbourne, Australia with 9+ years of experience, and she knows how to make data work. She's been an official trainer for Elasticsearch and Kibana, crafting the courses that empower people to unlock the secrets of data. Prior to that, she worked for a start-up in India as the data engineer behind building and maintaining data engineering pipelines, then transforming that raw information into stunning visuals and insights using Kibana and other data engineering technologies. Today, she's an advocate, a mentor, and a bridge-builder, inviting everyone to find their own rhythm in the data's dance. Whether you're a novice or seasoned analyst, brace yourself for her infectious enthusiasm and knack for making the driest of datasets sing!
Read more about Krishna Shah