


Customizing a graph
We can customize the appearance of vertices in our graphs by applying personalized colors and icons. Additionally, we have the ability to configure the number of vertices that are added to the graph during a search operation. We can also block certain terms and do many more things.
Each vertex in the graph is associated with a color, icon, and label. If you wish to modify the color or icon for all vertices within a specific category, locate the style icon in the control bar and click on it, as shown in the following screenshot:
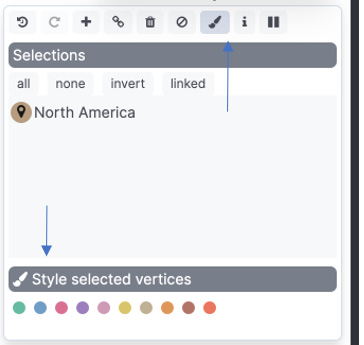
Figure 7.7 – Styling options for vertices in graphs in Kibana
By default, the graph feature is designed to filter out unnecessary noise from your data. However, if this default setting does not align with your specific dataset, you have the option to make adjustments. Simply navigate to the Settings menu and select Advanced settings. From there, you can fine-tune how the graph queries your data, ensuring...


