Reader small image

You're reading from  Kibana 8.x – A Quick Start Guide to Data Analysis

Product typeBook
Published inFeb 2024
PublisherPackt
ISBN-139781803232164
Edition1st Edition
Right arrow
Author (1)
Krishna Shah
Krishna Shah
author image
Krishna Shah

Krishna Shah is a data architect from Melbourne, Australia with 9+ years of experience, and she knows how to make data work. She's been an official trainer for Elasticsearch and Kibana, crafting the courses that empower people to unlock the secrets of data. Prior to that, she worked for a start-up in India as the data engineer behind building and maintaining data engineering pipelines, then transforming that raw information into stunning visuals and insights using Kibana and other data engineering technologies. Today, she's an advocate, a mentor, and a bridge-builder, inviting everyone to find their own rhythm in the data's dance. Whether you're a novice or seasoned analyst, brace yourself for her infectious enthusiasm and knack for making the driest of datasets sing!
Read more about Krishna Shah

Right arrow

Finally, the Dashboard

If you’re sitting there wondering when we are really going to connect the pieces to finally see everything on one single glass of pane, then now is that time. We have the dashboard – an interface that helps us put all the puzzle pieces together – and we will finally draw out some insights and conclusions from it. As we know, visualizing data is the most effective method to understand its significance. By utilizing dashboards, you can transform your data, whether it is from a single or multiple perspectives, into a compilation of views that provide a clear understanding of the insights from the data. These views not only convey a narrative about the data but also enable you to concentrate solely on the data that holds relevance for you at any particular point in time.

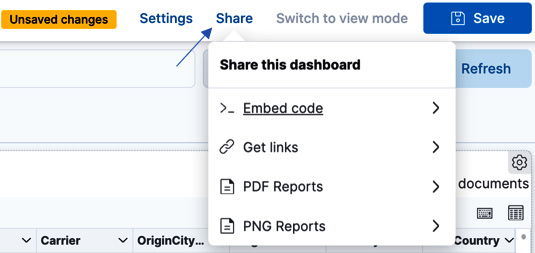
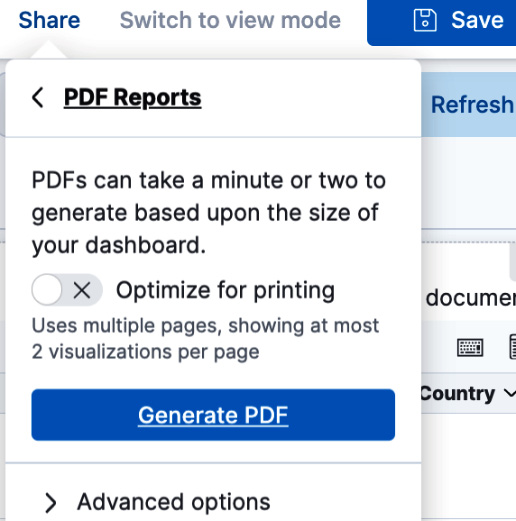
Let’s start looking into kickstarting the process of creating a dashboard, where we explore how it allows you to design, edit, and observe personalized dashboards....

Technical requirements

As per the basic requirements, we assume that you have data ingested in the cluster and that Elasticsearch and Kibana are set up on the nodes of (any) environment (the cloud or locally).

Once Kibana is up and running, we can navigate to the Kibana home page, select Try sample data, select Other sample data sets, click on Add data for the Kibana_sample_data_ecommerce dataset, and then select Kibana_sample_data_logs.

Exploring sample dashboards

Delving into the world of Kibana dashboards is like embarking on a treasure hunt for insights. Luckily, you don’t have to start with an empty map! Check out the Sample Dashboards section within Kibana – it’s a goldmine of pre-built visualizations waiting to be explored.

Imagine peeking at a dashboard titled [Logs] Web Traffic, as shown in Figure 8.2. A time series graph might showcase daily visitor trends, while a pie chart paints a picture of the top referring sources. You can click on segments to drill down further, uncovering specific campaigns or landing pages driving traffic. Kibana, as we have seen, is not just a tool for centralizing data and metrics; it also offers very interesting ways to explore and analyze that data. With its intuitive interface and powerful features, Kibana allows technical leads to quickly pinpoint the cause of spike alerts being triggered within their organization. They can easily drill down into data...

Creating a dashboard from scratch

With Kibana, you can customize your data in various formats, such as tables, vertical bar graphs, and maps. This allows you to easily compare your data side by side and identify patterns and relationships that may not be apparent at first glance.

The dashboards in Kibana support several types of panels that you can use to display your data. Whether you want to create a bar chart, a pie chart, or a heatmap and bring all of them together in a customized view, creating a customized dashboard is the way to go!

Let’s see in detail how this can be done:

  1. First, we need to finalize the visualizations you need to use, or create the visualizations if not already created.

    As we are aware, a dashboard is created from visualizations; hence, the first step will involve creating them or ensuring that we have all the required representations saved in the library for the use case you are targeting.

    For example, we can create a visualization by clicking...

Sharing the dashboard

Kibana offers a variety of ways to share your saved searches, dashboards, Visualize Library visualizations, and Canvas workpads. To access these options, simply navigate to the Share menu in the toolbar. From there, you can choose from several sharing options that are available to you, as shown in the following screenshot:

Figure 8.11 – The Share option on the dashboard

Figure 8.11 – The Share option on the dashboard

When we click the Share option, it gives us two ways to report and other ways to share the dashboard. When we see the reporting side of it, we can generate a PDF report, as shown here:

Figure 8.12 – The PDF Reports option on the dashboard

Figure 8.12 – The PDF Reports option on the dashboard

Upon clicking the Generate PDF option, it will simply download the dashboard on the local system as a PDF file. If optimized for printing, it will ensure to print all the pages in A4 size, which makes the viewing of the dashboard easier.

Alternatively, for users who intend to report the...

Summary

In this chapter, we studied in detail how a dashboard can enable users to see data insights all on one page, and we saw how to leverage features such as query and filter reflecting on every visualization present on the dashboard.

We also learned how we can either begin by exploring sample dashboards or create our own dashboard from scratch, adding all the use case-specific visualizations with diverse representation styles. Finally, we explored how we can start sharing these very interesting dashboards with team members, peers, or customers, presenting them with the insights that we have successfully extracted from a dataset.

In the next chapter, we shall go through some advanced concepts such as scripted fields, which will enable us to target a specific use case.

lock icon
The rest of the chapter is locked
You have been reading a chapter from
Kibana 8.x – A Quick Start Guide to Data Analysis
Published in: Feb 2024Publisher: PacktISBN-13: 9781803232164
Register for a free Packt account to unlock a world of extra content!
A free Packt account unlocks extra newsletters, articles, discounted offers, and much more. Start advancing your knowledge today.
undefined
Unlock this book and the full library FREE for 7 days
Get unlimited access to 7000+ expert-authored eBooks and videos courses covering every tech area you can think of
Renews at $15.99/month. Cancel anytime

Author (1)

author image
Krishna Shah

Krishna Shah is a data architect from Melbourne, Australia with 9+ years of experience, and she knows how to make data work. She's been an official trainer for Elasticsearch and Kibana, crafting the courses that empower people to unlock the secrets of data. Prior to that, she worked for a start-up in India as the data engineer behind building and maintaining data engineering pipelines, then transforming that raw information into stunning visuals and insights using Kibana and other data engineering technologies. Today, she's an advocate, a mentor, and a bridge-builder, inviting everyone to find their own rhythm in the data's dance. Whether you're a novice or seasoned analyst, brace yourself for her infectious enthusiasm and knack for making the driest of datasets sing!
Read more about Krishna Shah