

As we've seen so far, many of Flot's capabilities come from plugins. Flot's extensibility is one of its best features. It allows us to add custom functionality easily and organizes our code into manageable modules.
Here, we extract the running average functionality that we built in the There's more... section and put it into a custom plugin. This allows us to display the running average of any dataset with a simple setting:
...
<script>
(function ($) {
var calculateRunningAverage=function (data, numPoints) {
return data.map(function (point, i, arr) {
var pointsToAverage =
arr.slice(Math.max(0, i - numPoints + 1), i + 1);
var sum = pointsToAverage.reduce(function (a, b) {
return a + b[1];
}, 0);
var average = sum / Math.min(i + 1, numPoints);
return [ point[0], average ];
});
};
var addRunningAverage = function (plot, series) {
if (
series.runningAverage &&
series.runningAverage.show
) {
var allData = plot.getData();
var averageData = calculateRunningAverage(
series.data, series.runningAverage.numPoints);
allData.push({
data: averageData,
color: series.runningAverage.color
});
// disable the hook to prevent infinite recursion.
plot.hooks.processRawData =
plot.hooks.processRawData.filter(function (x) {
return x !== addRunningAverage;
});
plot.setData(allData);
plot.hooks.processRawData.push(addRunningAverage);
}
};
var init = function (plot) {
plot.hooks.processRawData.push(addRunningAverage);
};
var options = {
series: {
runningAverage: {
show: false,
numPoints: 2,
color: 'red'
}
}
};
$.plot.plugins.push({
name: 'runningAverage',
version: '0.1.0',
init: init,
options: options
});
}(jQuery));
var data = [
[0, 240], [1, 228], [2, 312], [3, 272], [4, 335],
[5, 348], [6, 348], [7, 320], [8, 351], [9, 341],
[10, 336], [11, 343], [12, 410], [13, 372], [14, 369],
[15, 425], [16, 375], [17, 377], [18, 479], [19, 439]
];
var data2 = data.map(function (d) {
return [d[0], d[1] + 200];
});
var dataset = [
{ data: data, runningAverage: {show: true} },
{ data: data2, runningAverage: {
show: true, numPoints: 8
} }
];
$.plot(
$('#sample'),
dataset,
{ lines: { show: true } }
);
</script>
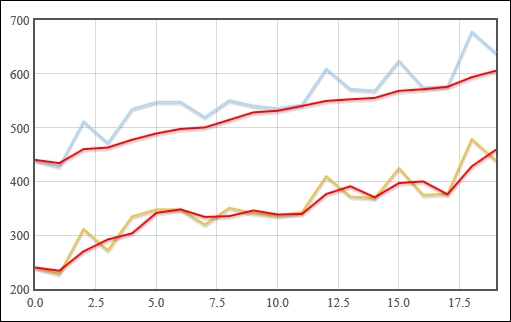
...We use our plugin to display the running averages (in red) of two series, but with different intervals for the average:
We start our plugin by containing it inside a closure. This allows us to code our plugin without having to worry about contaminating the global scope. We pass the jQuery object into the closure so that we can access and extend Flot with our plugin:
(function ($) {
...
}(jQuery);
Next, we define our plugin. It consists of three functions; calculateRunningAverage, addRunningAverage, and init; and one options object. The init function is the starting point of our plugin. Our plugin hooks into Flot's rendering pipeline at the processRawData phase, which occurs just before Flot interprets the data passed to it. We add our addRunningAverage function to the hook array. The function will be called once for every series in the dataset being plotted.
The addRunningAverage function uses the plot's getData and setData methods to retrieve the dataset and add the new running average data for the current series. Note that we must remove our hook before we call setData because setData calls processRawData internally, causing an infinite recursion. We then add the hook back after setData has been called.
Finally, we make Flot aware of our plugin by adding a plugin object to the $.plot.plugins array. The plugin object gives Flot some metadata about our plugin and tells it about our plugin's starting point, the init function. The object also includes the default options for our plugin. By convention, the options are set to disable the plugin by default; in this case, the show setting is set to false so that users of the plugin can choose to opt in to the plugin as they please.
Flot merges the default options with its options and the options on the individual series when a plot is made.
Our example plugin is very simple, but Flot's powerful extensibility allows plugins to do all sorts of things. For example, you could hook into Flot's rendering phases and draw arbitrary graphics directly onto the canvas, or you could bind to mouse and keyboard events on a plot to respond to user interaction.
You can learn more about plugins in the following Flot's documentation:
Introduction to plugins: https://github.com/flot/flot/blob/0.8.1/API.md#plugins
More plugin information: https://github.com/flot/flot/blob/0.8.1/PLUGINS.md