Plotting time series
Flot includes a plugin that handles time-based data. The plugin takes care of displaying the X axis accordingly, including date formatting, time zone calculations, and unit conversions.
Getting ready
Again, we can use the same boilerplate along with the time plugin:
...
  <script src="jquery.js"></script>
  <script src="jquery.flot.js"></script>
  <script src="jquery.flot.time.js"></script>
...
How to do it…
We enable the time plugin by setting mode to time on the xaxis setting. The time plugin also expects a specific data type for the x coordinates of our dataset as follows:
...
var data = [
[1357016400000, 0],
[1359694800000, 4],
[1362114000000, 2]
];
$('#sampleChart').plot(
[ data ],
{ xaxis: { mode: 'time' } }
);
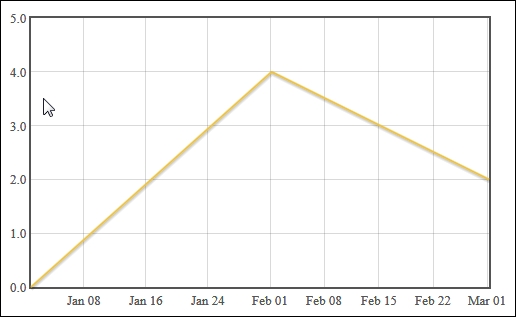
...The time plugin automatically draws the points in their appropriate positions on the chart and also changes the labels on the X axis to display the corresponding dates:
How it works…
The time plugin expects the x coordinates of our data set to be standard JavaScript timestamps. They represent the number of milliseconds since January 1, 1970 00:00:00 UTC. You can obtain these timestamps in JavaScript by using the getTime method on a Date object.
The plugin also assumes that the timestamps are in the UTC time zone. You may set the timezone setting under the xaxis setting to browser, if your data is in the user's time zone already. Other time zones are supported through a third-party timezoneJS plugin that you can find at https://github.com/mde/timezone-js.
The time plugin also includes settings to control the number of ticks displayed on the axis to use a twelve hour clock format and to change the text displayed for months and days. You can find more information in the Flot documentation available at https://github.com/flot/flot/blob/0.8.1/API.md#time-series-data.
There's more…
The time plugin also supports custom date and time formats using a formatting string that is a subset of the strftime standard from the C programming language. You can find more details in the preceding linked documentation.
Using custom date and time formats
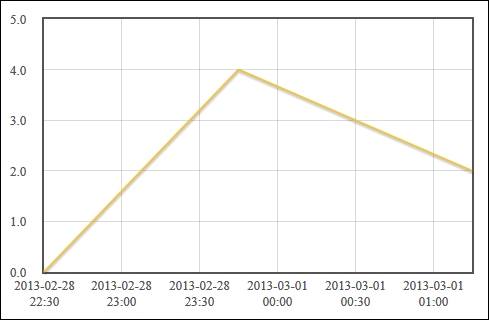
Here we use a custom formatting string to force the time plugin to show the full date and time on the X axis labels as follows:
...
    var data = [
      [new Date('2013-02-28T22:30:00Z').getTime(), 0],
      [new Date('2013-02-28T23:45:00Z').getTime(), 4],
      [new Date('2013-03-01T01:15:00Z').getTime(), 2]
    ];

    $('#sampleChart').plot(
      [ data ],
      { xaxis: {
        mode: 'time',
        timeformat: '%Y-%m-%d %H:%M'
      } }
    );
...
The labels on the X axis are replaced with text in the format we've specified: