


Displaying percentiles (Should know)
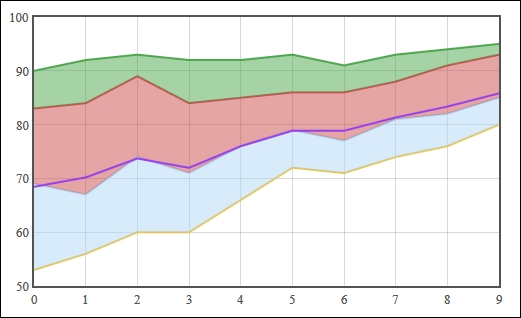
Flot's fillbetween plugin allows you to visualize percentiles by shading the area between the series that represent each percentile.
Getting ready
Include the fillbetween plugin as follows:
...
  <script src="jquery.js"></script>
  <script src="jquery.flot.js"></script>
  <script src="jquery.flot.fillbetween.js"></script>
...
How to do it...
The plugin uses id and fillBetween settings on each series object to identify and configure the filled areas:
...
  <script src="jquery.flot.fillbetween.js"></script>
  <script>
    var data = {
      '25%': [
        [0, 53], [1, 56], [2, 60], [3, 60], [4, 66],
        [5, 72], [6, 71], [7, 74], [8, 76], [9, 80]
      ],
      '50%': [
        [0, 69], [1, 67], [2, 74], [3, 71], [4, 76],
        [5, 79], [6, 77], [7, 81], [8, 82], [9, 85]
      ],
      '75%': [
        [0, 83], [1, 84], [2, 89], [3, 84], [4, 85],
        [5, 86], [6, 86], [7, 88], [8, 91], [9, 93]
      ],
      '90%': [
        [0, 90], [1, 92], [2, 93], [3, 92], [4, 92],
        [5, 93], [6, 91], [7, 93], [8, 94], [9, 95]
      ],
      'mean': [
        [0, 68.44], [1, 70.19], [2, 73.71], [3, 71.97],
        [4, 75.98], [5, 78.86], [6, 78.86], [7, 81.33],
        [8, 83.35], [9, 85.82]
      ]
    };
    var dataset = [
      { id: '25%', data: data['25%'], lines:{ fill: false } },
      { id: '50%', data: data['50%'], fillBetween: '25%' },
      { id: '75%', data: data['75%'], fillBetween: '50%' },
      { id: '90%', data: data['90%'], fillBetween: '75%' },
      { id: 'mean', data: data['mean'], lines:{ fill: false} }
    ];

    $.plot(
      $('.chart'),
      dataset,
      {
        lines: { fill: 0.5 },
        shadowSize: 0
      }
    );
  </script>
...
The plugin draws filled regions that help visualize the volume of the space between series:
How it works...
The fillbetween plugin is similar to the stack plugin. It takes your data and manipulates it so that the area between the specified series are filled, or shaded. The plugin does not calculate percentiles for you—it can be applied to any series—but it is especially useful for visualizing percentile data.
The plugin requires that you identify each series with the id setting so that you can refer to them in the fillBetween setting. In this case, we identify our series with names as 25%, 50%, and so on. We then fill the area between the appropriate series by using the fillBetween setting. For example, we shade the area between the 50% series and the 25% series by setting the fillBetween setting on the 50% series to 25%.


