Reader small image

You're reading from  Extending Power BI with Python and R - Second Edition

Product typeBook
Published inMar 2024
Reading LevelIntermediate
PublisherPackt
ISBN-139781837639533
Edition2nd Edition
Languages
Right arrow
Author (1)
Luca Zavarella
Luca Zavarella
author image
Luca Zavarella

Luca Zavarella has a rich background as an Azure Data Scientist Associate and Microsoft MVP, with a Computer Engineering degree from the University of L'Aquila. His decade-plus experience spans the Microsoft Data Platform, starting as a T-SQL developer on SQL Server 2000 and 2005, then mastering the full suite of Microsoft Business Intelligence tools (SSIS, SSAS, SSRS), and advancing into data warehousing. Recently, his focus has shifted to advanced analytics, data science, and AI, contributing to the community as a speaker and blogger, especially on Medium. Currently, he leads the Data & AI division at iCubed, and he also holds an honors degree in classical piano from the "Alfredo Casella" Conservatory in L'Aquila.
Read more about Luca Zavarella

Right arrow

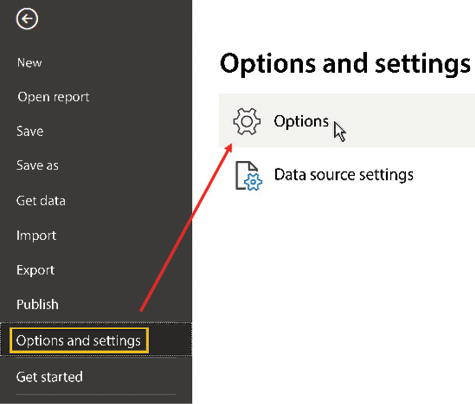
Configuring R with Power BI

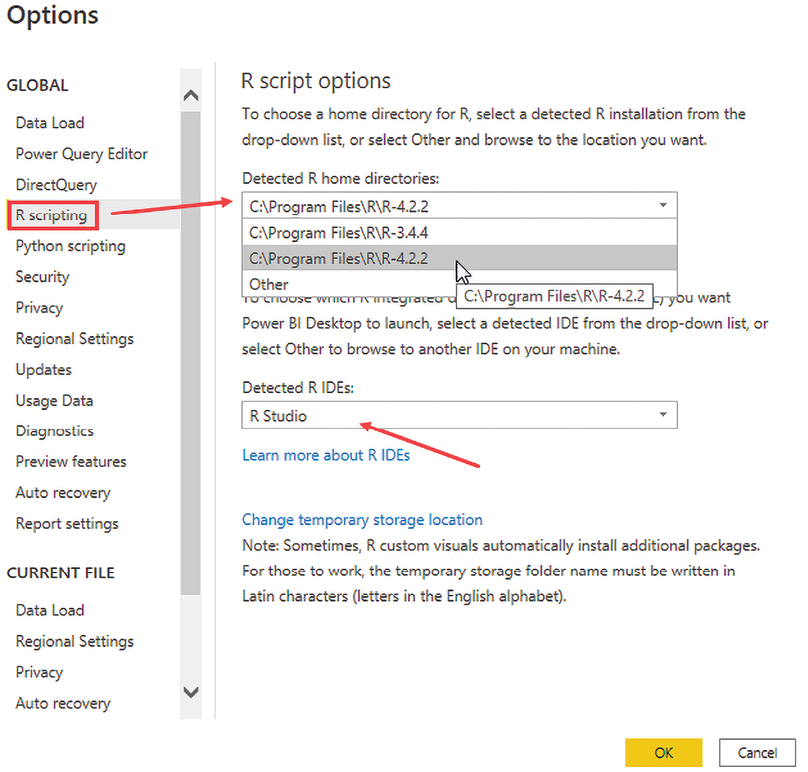
Power BI Desktop is not equipped with the analytical language engines presented in the previous chapter by default. Therefore, it is necessary to install these engines and properly configure Power BI Desktop to correctly interface with them. It is also recommended to install an Integrated Development Environment (IDE), enabling you to work in the way you are most comfortable.

We’ll look at how to get those engines up and running and give you some general guidelines on how to pick the most appropriate one for your needs. After that, we’ll look at how to make these engines interface with both Power BI Desktop and the Power BI service.

Finally, we will give some important tips on how to overcome some stringent limitations of R script visuals within the Power BI service.

In particular, this chapter will deal in detail with the following topics:

  • The available R engines
  • Choosing an R engine to install
  • Installing...

Technical requirements

This chapter requires you to have a working internet connection and Power BI Desktop already installed on your machine. It also requires you to have signed up for the Power BI service in the last part of the chapter (here’s a how-to: http://bit.ly/signup-powerbiservice). A Power BI free license is enough to test all the code in this book, as you will share reports only in your personal workspace.

The available R engines

There is more than one R distribution available on the market that you can use for free for your advanced analytics projects. In this section, we’ll explore the main details of each of them.

The CRAN R distribution

When it comes to installing the R engine, we almost always think of the open source software environment, par excellence, developed by a collective of contributors over the years known as CRAN R, also called base R (https://cran.r-project.org). To be exact, the Comprehensive R Archive Network (CRAN) is a network of web servers and FTP servers around the world whose goal is to preserve multiple identical and up-to-date versions of the R source code and the entire ecosystem of R packages developed by the community, along with all the R documentation.

One of the biggest advantages of CRAN R is its very active community of developers. Their contribution to the creation of new packages on CRAN is invaluable. That’s why if you...

Choosing an R engine to install

Once it is decided that CRAN R is the R distribution to adopt, the first question when installing an R engine is: “Which version should I install? Do I choose the latest one, or do I opt for a previous one?” The usual answer to these kinds of questions is: “It depends!” In our case, the goal is to use the R engine within Power BI, so we need to understand which versions are used by the various products that admit the use of R within them.

The R engines used by Power BI

We saw in Chapter 1, Where and How to Use R and Python Scripts in Power BI, that only two Power BI products are allowed to use scripts in R and Python: Power BI Desktop and the Power BI service (remember that Power BI embedded is implicitly included when talking about the Power BI service). So, the answer “It depends!” has a clearer connotation now: if you need to share your reports with people inside your organization, then you have to...

Installing an IDE for R development

The need to install a state-of-the-art R IDE for the development of code in Power BI comes from the need to have all the tools necessary to identify any bugs and quickly test the results of code chunks on the fly.

TIP

It is strongly suggested to test your R code in the IDE and verify the results before using it in Power BI.

There are many IDEs for R development on the market. Some examples are R-Brain IDE (RIDE), IntelliJ IDEA, and JupyterLab, but it is estimated that over 90% of R programmers use RStudio as their primary IDE because of the countless features that simplify their daily work. For this reason, we suggest that you also use this IDE to test the code you will encounter in this book.

Installing RStudio

Installing RStudio (at the time of writing the chapter, the version is 2022.07.2+576) on your machine is very simple:

  1. Go to https://posit.co/download/rstudio-desktop/ and click the DOWNLOAD RSTUDIO...

Configuring Power BI Desktop to work with R

Once you have installed the R engines necessary for the development of your reports and the RStudio IDE, you must configure Power BI Desktop so that it properly references these tools. This is really a very simple task:

  1. In Power BI Desktop, go to the File menu, click on the Options and settings tab, and then click on Options:
Figure 2.14 – Opening the Power BI Desktop Options and settings window

Figure 2.18: Opening the Power BI Desktop Options and settings window

  1. In the Options window, click on the R scripting tab on the left. The contents of the panel on the right will update, giving you the option to select the R engine to reference and the R IDE to use for R script visuals:
Graphical user interface, text, application  Description automatically generated

Figure 2.19: Choosing the engine and the IDE to work with in Power BI Desktop

  1. As you can see, Power BI Desktop automatically identifies the installed R engines and IDEs. For the moment, select the latest version of the engine (in our case, it is 4.2.2), in order to be aligned...

Configuring the Power BI service to work with R

As you learned in the The R engines used by Power BI section of this chapter, the Power BI service uses different R engines depending on whether the scripts are used in R script visuals or in Power Query for data transformation. In the first case, the engine is pre-installed on the cloud.

IMPORTANT NOTE

If the data sources of your report come exclusively from online services (e.g., Azure SQL Database) or the web, and if the R scripts in your report are used only in the R script visuals, you don’t need to install the data gateway in personal mode to refresh the datasets.

In the second case, or if at least one dataset in your report is fed from an on-premises data source or on an Azure VM, you need to install the on-premises data gateway in personal mode on any machine of your choice in order to make the Power BI service communicate with the R engine you installed on that machine.

Installing the on...

R script visuals limitations

R script visuals have some important limitations regarding the data they can handle, both as input and output:

  • An R script visual can handle a data frame with only 150,000 rows. If there are more than 150,000 rows, only the first 150,000 rows are used and a relevant message is displayed on the image.
  • R script visuals have an output size limit of 2 MB.

You must also be careful not to exceed the 5 minutes of runtime calculation for an R script visual in order to avoid a time-out error. Moreover, in order not to run into performance problems, note that the resolution of the R script visual plots is fixed at 72 DPI.

As you can imagine, some limitations of R script visuals are different depending on whether you run the visual on Power BI Desktop or the Power BI service.

If you think you need to develop reports intended only for Power BI Desktop, without the need to publish them on the service, you can do any of the following...

Summary

In this chapter, you learned about the most popular free R engines in the community. In particular, you learned about the performance advantages introduced by Microsoft in its distribution of R, even if this distribution will be retired in the near future. You also learned how to enhance the standard CRAN R with the oneMKL libraries for multi-threaded calculations.

Taking note of the unique features of Power BI Desktop and the Power BI service, you have learned how to properly choose the engines and how to install them.

You have also learned about the most popular IDE in the R community and how to install it.

In addition, you were introduced to all of the best practices for properly configuring both Power BI Desktop and the Power BI service with R, whether in a development or enterprise environment.

Finally, you learned about some of the limitations of using R with Power BI, knowledge of which is critical to avoid making mistakes in developing and deploying...

Test your knowledge

  1. What are the most popular R engines to date and which of them will be phased out?
  2. What is the most obvious advantage of Microsoft’s R distributions?
  3. Is it possible to introduce the advantage in question 2 for CRAN R as well? If so, can this be done directly from the software installer?
  4. You decide to install the latest available version of CRAN R, and through this, you develop some transformation steps in Power Query. What do you need to be able to publish your report to the Power BI service and allow it to be refreshed regularly?
  5. Suppose you have installed only the R engine mentioned in Question 4 and you also add a plot made with an R script visual to the same report mentioned in Question 4. What are the problems you’ll encounter on Power BI Desktop? What are the problems you’ll encounter when you publish the report to the Power BI service?
  6. Is it possible to refresh datasets of a published report using...
lock icon
The rest of the chapter is locked
You have been reading a chapter from
Extending Power BI with Python and R - Second Edition
Published in: Mar 2024Publisher: PacktISBN-13: 9781837639533
Register for a free Packt account to unlock a world of extra content!
A free Packt account unlocks extra newsletters, articles, discounted offers, and much more. Start advancing your knowledge today.
undefined
Unlock this book and the full library FREE for 7 days
Get unlimited access to 7000+ expert-authored eBooks and videos courses covering every tech area you can think of
Renews at $15.99/month. Cancel anytime

Author (1)

author image
Luca Zavarella

Luca Zavarella has a rich background as an Azure Data Scientist Associate and Microsoft MVP, with a Computer Engineering degree from the University of L'Aquila. His decade-plus experience spans the Microsoft Data Platform, starting as a T-SQL developer on SQL Server 2000 and 2005, then mastering the full suite of Microsoft Business Intelligence tools (SSIS, SSAS, SSRS), and advancing into data warehousing. Recently, his focus has shifted to advanced analytics, data science, and AI, contributing to the community as a speaker and blogger, especially on Medium. Currently, he leads the Data & AI division at iCubed, and he also holds an honors degree in classical piano from the "Alfredo Casella" Conservatory in L'Aquila.
Read more about Luca Zavarella