


Installing Streamlit
In order to run any Streamlit apps, you must first install Streamlit. I’ve used a package manager called pip to do this, but you can install it using any package manager you choose (for example, brew). This book uses Streamlit version 1.13.0 and Python 3.9, but it should work on newer versions as well.
Throughout this book, we’ll be using a mix of both terminal commands and code written in Python scripts. We will signpost in which location to run the code to make this as clear as possible. To install Streamlit, run the following code in a terminal:
pip install streamlit
Now that we have Streamlit downloaded, we can call it directly from our command line using the preceding code to kick off Streamlit’s demo using the following:
streamlit hello
Take some time to explore Streamlit’s demo and take a glance at any code that you find interesting! We’re going to borrow and edit the code behind the plotting demo, which illustrates a combination of plotting and animation with Streamlit. Before we dive in, let’s take a second and talk about how to organize Streamlit apps.
Organizing Streamlit apps
Each Streamlit app we create in this book should be contained in its own folder. It is tempting to create new files for each Streamlit app, but this promotes a bad habit that will bite us later when we talk about deploying Streamlit apps and deal with permissions and data for Streamlit.
I would recommend that you have a dedicated individual folder that will house all the apps you’ll create throughout this book. I have named mine streamlit_apps. The following command will make a new folder called streamlit_apps and make it our current working directory:
mkdir streamlit_apps
cd streamlit_apps
All the code for this book is housed at https://github.com/tylerjrichards/Getting-Started-with-Streamlit-for-Data-Science, but I would highly recommend coding by hand for practice. Later in this book, we’ll talk about how to create multi-page apps, which essentially allow us to have many mini-data apps within our central monoapp. Ensuring that our Streamlit apps are well organized will help us with that!
Streamlit plotting demo
First, we’re going to start to learn how to make Streamlit apps by reproducing the plotting demo we saw before in the Streamlit demo with a Python file that we’ve made ourselves. In order to do that, we will do the following:
- Make a Python file where we will house all our Streamlit code.
- Use the plotting code given in the demo.
- Make small edits for practice.
- Run our file locally.
Our first step is to create a folder called plotting_app, which will house our first example. The following code makes this folder when run in the terminal, changes our working directory to plotting_app, and creates an empty Python file we’ll call plot_demo.py:
mkdir plotting_app
cd plotting_app
touch plot_demo.py
Now that we’ve made a file called plot_demo.py, open it with any text editor (if you don’t have one already, I’m partial to VS Code (https://code.visualstudio.com/download)). When you open it up, copy and paste the following code in to your plot_demo.py file:
import streamlit as st
import time
import numpy as np
progress_bar = st.sidebar.progress(0)
status_text = st.sidebar.empty()
last_rows = np.random.randn(1, 1)
chart = st.line_chart(last_rows)
for i in range(1, 101):
    new_rows = last_rows[-1, :] + np.random.randn(5, 1).cumsum(axis=0)
    status_text.text("%i%% Complete" % i)
    chart.add_rows(new_rows)
    progress_bar.progress(i)
    last_rows = new_rows
    time.sleep(0.05)
progress_bar.empty()
# Streamlit widgets automatically run the script from top to bottom. Since
# this button is not connected to any other logic, it just causes a plain
# rerun.
st.button("Re-run")
This code does a few things. First, it imports all the libraries needed and creates a line chart in Streamlit’s native graphing framework that starts at a random number sampled from a normal distribution with mean 0 and variance 1. And then it runs a for loop that keeps sampling new random numbers in bunches of 5 and adding that to the sum we had before while waiting for a twentieth of a second so we can see the graph change, simulating an animation.
By the end of this book, you will be able to make apps like this extremely quickly. But for now, let’s run this locally by typing the following code in our terminal:
streamlit run plot_demo.py
This should open a new tab with your app in your default web browser. We should see our app run as shown in the following figure. Your app will not show this exact line, as random numbers are being generated during each run, but other than that, the app should look the same!
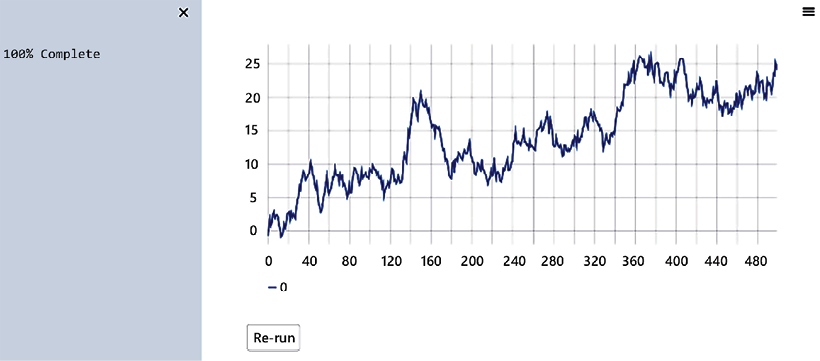
Figure 1.1: Plotting demo output
This is how we will run every Streamlit app, by first calling streamlit run and then pointing Streamlit toward the Python script that houses our app’s code. Now let’s change something small within the app so we better understand how Streamlit works. The following code changes how many random numbers we plot on our graph, but feel free to make any changes you’d like. Make your changes using the following code, save your changes in your text editor of choice, and run the file again:
import streamlit as st
import time
import numpy as np
progress_bar = st.sidebar.progress(0)
status_text = st.sidebar.empty()
last_rows = np.random.randn(1, 1)
chart = st.line_chart(last_rows)
for i in range(1, 101):
    new_rows = last_rows[-1, :] + np.random.randn(50, 1).cumsum(axis=0)
    status_text.text("%i%% Complete" % i)
    chart.add_rows(new_rows)
    progress_bar.progress(i)
    last_rows = new_rows
    time.sleep(0.05)
progress_bar.empty()
# Streamlit widgets automatically run the script from top to bottom. Since
# this button is not connected to any other logic, it just causes a plain
# rerun.
st.button("Re-run")
You should notice that Streamlit detected a change to the source file and is prompting you to rerun the file if you’d like. Click Rerun (or Always rerun if you want this behavior to be the default, which I almost always do), and watch your app change.
Feel free to try making some other changes to the plotting app to get the hang of it! Once you are ready, let’s move on to making our own apps.