Reader small image

You're reading from  R for Data Science Cookbook (n)

Product typeBook
Published inJul 2016
Reading LevelIntermediate
Publisher
ISBN-139781784390815
Edition1st Edition
Languages
Tools
Concepts
Right arrow
Author (1)
Yu-Wei, Chiu (David Chiu)
author image
Yu-Wei, Chiu (David Chiu)

Yu-Wei, Chiu (David Chiu) is the founder of LargitData (www.LargitData.com), a startup company that mainly focuses on providing big data and machine learning products. He has previously worked for Trend Micro as a software engineer, where he was responsible for building big data platforms for business intelligence and customer relationship management systems. In addition to being a start-up entrepreneur and data scientist, he specializes in using Spark and Hadoop to process big data and apply data mining techniques for data analysis. Yu-Wei is also a professional lecturer and has delivered lectures on big data and machine learning in R and Python, and given tech talks at a variety of conferences. In 2015, Yu-Wei wrote Machine Learning with R Cookbook, Packt Publishing. In 2013, Yu-Wei reviewed Bioinformatics with R Cookbook, Packt Publishing. For more information, please visit his personal website at www.ywchiu.com. **********************************Acknowledgement************************************** I have immense gratitude for my family and friends for supporting and encouraging me to complete this book. I would like to sincerely thank my mother, Ming-Yang Huang (Miranda Huang); my mentor, Man-Kwan Shan; the proofreader of this book, Brendan Fisher; Members of LargitData; Data Science Program (DSP); and other friends who have offered their support.
Read more about Yu-Wei, Chiu (David Chiu)

Right arrow

Chapter 6. Making Interactive Reports

This chapter covers the following topics:

  • Creating R Markdown reports

  • Learning the markdown syntax

  • Embedding R code chunks

  • Creating interactive graphics with ggvis

  • Understanding basic syntax and grammar

  • Controlling axes and legends

  • Using scales

  • Adding interactivity to a ggvis plot

  • Creating an R Shiny document

  • Publishing an R Shiny report

Introduction


After completing data analysis, it is important to document the research results and share the findings with others. The most common methods involve documenting results through text, slides, or web pages. However, these formats are generally limited to only sharing the results and don't often include the research process. As a result, other researchers cannot reproduce the research, making it hard to fully understand how the author conducted the analysis. Without knowing how to replicate the research, the authenticity of the study may be questioned.

R scripts can be used to perform data analysis and generate figures, and it is possible to create a reproducible report by copying all the code and images into a document. However, as this is quite labor intensive, there is a risk of making errors. A better solution is to automate the documentation process. This allows the user to dynamically generate a report, in any format, which records both scripts and the analysis results.

There...

Creating R Markdown reports


RStudio has an R Markdown workflow built in; we can use its GUI to create markdown reports in HTML, PDF, slide, or Microsoft Word format. In this recipe, we will introduce how to build an R Markdown report with RStudio.

Getting ready

Ensure you have installed the latest versions of R and RStudio on your operating system. If you have not yet installed RStudio, please visit the following URL to download the most recent version:

https://www.rstudio.com/products/rstudio/download/

How to do it…

Please perform the following steps to create an R Markdown report:

  1. First, click on File | New File | R Markdown on the menu bar:

    Figure 1: Create an R Markdown report

  2. Next, select the document type in the left-hand side menu, then fill in the Title and Author, and choose the output format in the right-hand side menu:

    Figure 2: Fill in the meta information of an R Markdown report

  3. Moving on, we can now see a markdown document with a YAML header and content in markdown syntax. You can now...

Learning the markdown syntax


Markdown is a lightweight markup language; it allows anyone to quickly create a formatted document in plain text instead of using complicated HTML. In this recipe, we introduce how to write a report with markdown syntax.

Getting ready

Ensure you have installed the latest version of R and RStudio on your operating system. Also, you need to have created and opened a new R Markdown (.rmd) file in RStudio.

How to do it…

Please perform the following steps to write simple markdown syntax:

  1. First, create headings by placing a hashtag # in front of the words:

    Markdown

    Preview

    # H1

    ## H2

    ### H3

  2. Next, emphasize words by style with bold, italics, and strikethrough:

    Markdown

    Preview

    This is plan text:

    *italics1*

    _italics2_

    **bold1**

    __bold2__

    ~~Strikethrough~~

  3. For list items, we can list items in an ordered item list or an unordered item list:

    Embedding R code chunks


    In an R Markdown report, one can embed R code chunks into the report with the knitr syntax. In this recipe, we introduce how to create and control the output with different code chunk configurations.

    Getting ready

    Ensure you have installed the latest version of R and RStudio on your operating system. Also, you need to have created and opened a new R Markdown (.rmd) file in RStudio.

    How to do it…

    Please perform the following steps to create an R code chunk in the markdown report:

    1. First, create a basic code chunk with the knitr syntax:

    Markdown

    Preview

    1. First Ordered list item

    2. Second Ordered List Item

      • Unordered sub-list

    • Unordered List Item

      1. Ordered sub-list-1

      2. Ordered...

    Markdown

    Preview

    ```{r}

    # code block

    a <- 3

    b <- 2

    a + b

    ```

  4. We can hide the script by setting echo=FALSE:

    Markdown

    Preview

    ```{r, echo=FALSE}

    # code block

    a <- 3

    b <- 2

    a + b

    ```

  5. Alternatively, we can stop evaluating the code by setting eval=FALSE:

    Markdown

    Preview

    ```{r, eval=FALSE}

    # code block

    a <- 3

    b <- 2

    a + b

    ```

  6. Moreover, we can choose not to render both evaluation result and script by setting include...

Creating interactive graphics with ggvis


In order to interact with the reports figures, one can create an interactive graphic with ggvis. In this recipe, we demonstrate how to build our first interactive plot from the real estate dataset.

Getting ready

Before starting this recipe, you should download the RealEstate.csv dataset from the following GitHub link:

https://github.com/ywchiu/rcookbook/blob/master/chapter8/RealEstate.csv

How to do it…

Please perform the following steps to create an interactive plot with ggvis:

  1. Install and load the ggvis package:

    > install.packages("ggvis")
    > library(ggvis)
    
  2. Import RealEstate.csv into an R session:

    > house <- read.csv('RealEstate.csv', header=TRUE)
    > str(house)
    'data.frame': 781 obs. of  8 variables:
     $ MLS        : int  132842 134364 135141 135712 136282 136431 137036 137090 137159 137570 ...
     $ Location   : Factor w/ 54 levels " Arroyo Grande",..: 21 44 44 39 50 42 50 50 39 22 ...
     $ Price      : num  795000 399000 545000 909000 109900 ...

Understanding basic syntax and grammar


The ggvis uses similar grammar and syntax to ggplot2, and we can use this basic syntax to create figures. In this recipe, we cover how to use ggvis syntax and grammar to build advanced plots.

Getting ready

Ensure you have installed and loaded ggvis into your R session. Also, you need to complete the previous steps by storing house in your R environment.

How to do it…

Please perform the following steps to create plots with ggvis:

  1. First, create a scatterplot by mapping Size to the x axis and Price to the y axis. Furthermore, we can assign different colors or shapes to points with different statuses:

    > house %>% ggvis(~Size, ~Price, fill=~Status, size=10, shape=~Status) %>% layer_points()
    

    Figure 11: A scatterplot in different shapes and colors by housing status

  2. Also, we can use the add_props function to change the fill color to red:

    > house %>% ggvis(~Size, ~Price, fill=~Status, size=10, shape=~Status) %>% layer_points() %>% add_props(fill...

Controlling axes and legends


Besides making different plots with various layer types, one can control the axes and legends of a ggvis plot. In this recipe, we demonstrate how to set the appearance properties of both axes and legends.

Getting ready

Ensure you have installed and loaded ggvis into your R session. You also need to complete the previous steps by storing house in your R environment.

How to do it…

Please perform the following steps to control axes and legends in ggvis:

  1. First, we use the add_axis function to control the axis orientation and label of a ggvis plot:

    > house %>% ggvis(~Size, ~Price) %>% layer_points() %>% 
    +   add_axis("x", title = "Real Estate Square Feet", orient="top") %>% 
    +   add_axis("y", title = "Real Estate Price", title_offset = 80)
    

    Figure 20: Creating an axis on the ggvis plot

  2. We can control the scale of the axis:

    > house %>% ggvis(~Size, ~Price) %>% layer_points() %>% 
    +   add_axis("x", title = "Real Estate Square Feet", 
    +          ...

Using scales


Besides changing the appearance of axes and legends, we can rescale the mapping of the data and how it should be displayed on the plot with the scale function. In this recipe, we introduce how to scale data in ggvis.

Getting ready

Ensure you have installed and loaded ggvis into your R session. Also, you need to complete the previous steps by storing house in your R environment.

How to do it …

Please perform the following steps to rescale data in ggvis:

  1. First, create a bar plot and then replace the linear scale with a power scale:

    > house %>% ggvis(~Status, ~Price, fill=~Status) %>% layer_bars() %>% scale_numeric("y", trans = "pow", exponent = 0.2)
    

    Figure 26. Adjusting the scale of the bar plot

  2. We can change the fill color with the scale_nominal function:

    > house %>% ggvis(~Status, ~Price, fill=~Status) %>% layer_bars() %>% scale_nominal("fill", range = c("pink", "green", "lightblue"))
    

    Figure 27. Changing the fill color of the bar plot

How it works…

In the previous...

Adding interactivity to a ggvis plot


One of the most attractive features of ggvis is that it can be used to create an interactive web form. This allows the user to subset the data, or even change the visual properties of the plot, through interacting with the web form. In this recipe, we introduce how to add interactivity to a ggvis object.

Getting ready

Ensure you have installed and loaded ggvis into your R session. Also, you need to complete the previous steps by storing house in your R environment.

How to do it…

Please perform the following steps to add interactivity to ggvis:

  1. First, make a bar plot with a drop-down menu and color options:

    > house %>% 
    +     ggvis(~Status, ~Price, fill:= input_select(c("red","blue"), label="Fill Color")) %>% 
    +     layer_bars() %>%
    +     add_axis("x", title = "Status", title_offset = 40) %>%
    +     add_axis("y", title = "Price", title_offset = 80)
    

    Figure 28: Adding a drop-down menu with color options

  2. Create a size slider and a color input text...

Creating an R Shiny document


Having introduced how to make an R Markdown document and ggvis plot, we can now combine these two together in a single report. However, the interactivity property of ggvis does not work with a regular R Markdown report. Instead, we can only enable the interactivity of the plot in a Shiny document. In this recipe, we introduce how to create a Shiny document.

Getting ready

Ensure you have installed and loaded ggvis into your R session. Also, you need to complete the previous steps by storing house in your R environment.

How to do it…

Please perform the following steps to create a Shiny document:

  1. First, click File | New File | R Markdown on the menu bar:

    Figure 35: Create an R Markdown file

  2. Next, choose Shiny as the document type in the left-hand side menu, and then fill in the Title and Author, and select the output format in the right-hand side menu:

    Figure 36: Input title and author of the R Markdown report

  3. Type the code that generates a ggvis plot into R chunks:

    ```...

Publishing an R Shiny report


After creating our interactive report with the Shiny application, we can publish our report online. In this recipe, we introduce how to publish an R Shiny report online.

Getting ready

Ensure you have installed and loaded ggvis into your R session. Also, you need to complete the previous steps by storing house in your R environment.

How to do it…

Please perform the following steps to publish your Shiny document online:

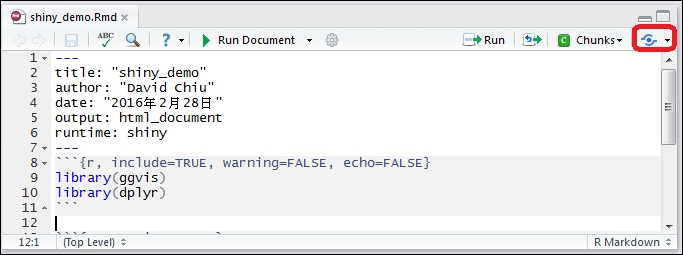
  1. First, click Publish Document on the upper-right side of the document:

    Figure 40: Publish the Shiny document

  2. If you have not installed the required packages, you should click Yes to install the required packages for publishing the Shiny document:

    Figure 41: Install the required packages to publish Shiny app

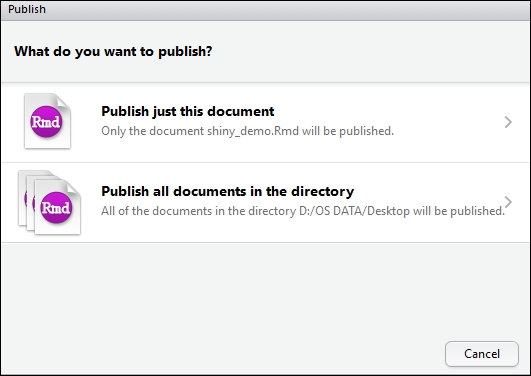
  3. Click on Publish just this document:

    Figure 42: Click on publish just this document

  4. At this point, RStudio requires you to connect your ShinyApps account with app tokens. Therefore, you should log in to your account to retrieve the token:

    Figure 43: ShinyApps...

lock icon
The rest of the chapter is locked
You have been reading a chapter from
R for Data Science Cookbook (n)
Published in: Jul 2016Publisher: ISBN-13: 9781784390815
Register for a free Packt account to unlock a world of extra content!
A free Packt account unlocks extra newsletters, articles, discounted offers, and much more. Start advancing your knowledge today.
undefined
Unlock this book and the full library FREE for 7 days
Get unlimited access to 7000+ expert-authored eBooks and videos courses covering every tech area you can think of
Renews at $15.99/month. Cancel anytime

Author (1)

author image
Yu-Wei, Chiu (David Chiu)

Yu-Wei, Chiu (David Chiu) is the founder of LargitData (www.LargitData.com), a startup company that mainly focuses on providing big data and machine learning products. He has previously worked for Trend Micro as a software engineer, where he was responsible for building big data platforms for business intelligence and customer relationship management systems. In addition to being a start-up entrepreneur and data scientist, he specializes in using Spark and Hadoop to process big data and apply data mining techniques for data analysis. Yu-Wei is also a professional lecturer and has delivered lectures on big data and machine learning in R and Python, and given tech talks at a variety of conferences. In 2015, Yu-Wei wrote Machine Learning with R Cookbook, Packt Publishing. In 2013, Yu-Wei reviewed Bioinformatics with R Cookbook, Packt Publishing. For more information, please visit his personal website at www.ywchiu.com. **********************************Acknowledgement************************************** I have immense gratitude for my family and friends for supporting and encouraging me to complete this book. I would like to sincerely thank my mother, Ming-Yang Huang (Miranda Huang); my mentor, Man-Kwan Shan; the proofreader of this book, Brendan Fisher; Members of LargitData; Data Science Program (DSP); and other friends who have offered their support.
Read more about Yu-Wei, Chiu (David Chiu)