Reader small image

You're reading from  Pentaho 8 Reporting for Java Developers

Product typeBook
Published inSep 2017
Reading LevelIntermediate
PublisherPackt
ISBN-139781788298995
Edition1st Edition
Languages
Tools
Right arrow
Authors (2):
Francesco Corti
Francesco Corti
author image
Francesco Corti

Francesco Corti is an enthusiastic consultant in software solutions and loves working in developer, sales, and customers teams. Proud of the role of a software engineer, he is often involved in pre-sales presentations, public speaking, and IT courses. Developing software, designing architectures, and defining solutions in ECM/BPM and BI are his favorite areas of interest. He has completed dozens of projects, from very small ones to more complex ones, in almost 20 years of experience. A product evangelist at Alfresco, Francesco represents the famous open source ECM in the developer community. In addition to helping developers adopt Alfresco technologies, he often helps Alfresco to improve the developer experience through talks, articles, blogging, user demonstrations, recorded demonstrations, or the creation of sample projects. He is the inventor and principal developer of Alflytics (previously named Alfresco Audit Analytics and Reporting), the main business intelligence solution over Alfresco ECM, entirely based on the Pentaho suite. He authored the Pentaho Reporting video course with more than 40 videos and courses on the Pentaho Reporting Designer and SDK. Francesco has specialty and principal experiences in enterprise content management solutions with Alfresco ECM and Hyland OnBase (he is an OnBase certified installer); business process management solutions with Activiti, JBPM, and Hyland OnBase; data capture solutions with Ephesoft, Hyland OnBase, and custom software; record management solutions with O'Neil software and custom software (using Alfresco ECM and Hyland OnBase); and portal and collaboration with Liferay and MS SharePoint.
Read more about Francesco Corti

View More author details
Right arrow

Chapter 5. Design and Layout in Report Designer

In the previous chapters, you were introduced to Pentaho Report Designer and you started to use it, developing simple and complex reports either by using the wizard or starting from scratch. In this chapter, you will dive deep into the concepts and functionality of Pentaho Report Designer related to the design and layout of a report.

You will first refresh the basics around Report Designer's user interface and you will then learn more about the core layout bands presented in the Report Designer, including detail and group bands. From there, you will explore in detail the various elements available to designers, how they are used, and what they might be used for.

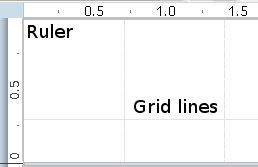
You will also learn the ins and outs of visual layout within the reporting canvas, including advanced concepts such as grids and guides. You will close the chapter with more details about working with the various output formats supported by Pentaho Reporting.

This chapter is written as...

Report Designer user interface components


In Chapter 2Getting Started with Report Designer, you discovered the composition of the user interface, and in Chapter 4, Creating a Report with Pentaho Designer, you used Report Designer to develop both very simple and complex reports, discovering most of the relevant features regarding designing and layout. Before completing the discovery of the whole features, as a reminder, let's recap in the following list the components you can recognize in Report Designer user interface, as shown in the screenshot that follows. This will be useful in the following sections, to discuss the details and the advanced features connected to design and layout.

  • The menu and toolbar on the upper part of the window
  • The report element palette, on the left, where you can select report elements for your report
  • The report canvas tab panel, which displays your reports
  • The report explorer panel with the structure tab (and the Data tab) which displays the entire report in object...

Master report and report bands properties


Now that the concepts of element and property have been introduced, let's start talking about the root of a report (the Master Report element) and the first level in the tree structure, the bands. Specifically, we are going to describe the properties related to each type of element, starting from the common ones and then describing the specific ones, element per element.

Every Pentaho report you create has a Master Report element as the root of the tree hierarchy. The Master Report element is not explicitly visible in the preview or the report canvas, but it contains a set of general properties. In the following section, dedicated to the Master Report element, you will learn more about the specific properties of this root element.

When first creating a report, in your canvas and report explorer structure tree, you will see: Page Header, Report Header, Details , Report Footer, and Page Footer band. These bands, along with other bands, including Group...

Report elements


All available report elements appear in the palette and may be dragged and dropped into the report canvas. Report elements make up the content of your report. They range from the label and text elements to the graphic, chart, and sub-report elements.

Like bands, the other report elements are also shown in the structure tab of report explorer and the list of properties is available in the report element properties. Like the elements described in the previous section, the report elements also inherit the existing properties from their parent and they propagate the common properties to the children elements.

In this section, you will learn the properties related to each type of element in the palette. As we saw in the previous section about bands, you will start from the common ones and then you will see a detailed description for each element.

Note

Also valid in this case is the suggestion shared earlier in the book: play as much as you can with elements and Report Designer to...

Hiding and showing bands


In the previous sections, you learnt much about the report's structure through the report explorer and its hierarchical definition, from the root called Master Report to the first level represented by the bands, and the sub-elements defining the visible content of the report. This section describes the possibility of hiding (or showing) some elements, to customize the final report's layout.

As an example, you can focus your attention to the structure shown in report explorer and the visible bands (and content) in the report canvas. As introduced earlier in the chapter, by default, the report canvas shows the Page Header, Report Header, Details, Report Footer, and Page Footer bands. But taking a look at the report's structure, you can also find the Group element with nested Group Header, Details Header, Details Footer, and Group Footer bands. As you can easily imagine, the last set of bands come hidden by default.

To show the hidden elements (usually bands) or hide...

Visual layout in Report Designer


With Pentaho Report Designer, you have pixel level control of your individual elements within a report. Grid and guide lines may appear within each report canvas band, which make it simple to align and configure locations of the elements.

The grid

By default, the report grid is enabled. To hide the grid, disable the menu item View | Grids | Show. The grid presents itself in point units (also known as pixel units), with a light grey grid line displayed every 25 pixels. Grid lines are useful for visual feedback of alignment, as well as for providing a method for snapping elements to the grid. This makes aligning of elements a simple exercise.

To adjust the ruler unit to centimeters, millimeters, inches, or picas, go to the View | Units  sub-menu. The default grid size may be adjusted by launching the grid size dialog. Select the View | Grids | Settings menu item and adjust your grid sizing. You may show or hide the grid by selecting the menu item View | Grids...

Pentaho Report Designer shortcut keys


The following table shows the list of all the shortcut keys available in Pentaho Report Designer:

Shortcut key

Description

Shortcut key

Description

Ctrl+N

Create a new report

Ctrl+Arrow key

Move element one grid line in direction

Ctrl+Shift+N

Launch the report wizard

Arrow Key

Move element by one pixel in the direction of the arrow key

Ctrl+O

Bring up the Open Report dialog

Ctrl+A

Select all

Ctrl+Shift+NumPad/

Bring up the Open Report dialog from the repository

Escape

Clear all selection

Ctrl+F

Close the report

Ctrl+Quote

Show or hide the grids

Ctrl+S

Save the report

Ctrl+1

Font properties

Ctrl+Shift+P

Publish the report in the repository

Ctrl+B

Bold element font

Ctrl+Z

Undo

Ctrl+I

Italicize element font

Ctrl+Y

Redo

Ctrl+H

Bring to front

Ctrl+X

Cut

Ctrl+U

Send forward

Ctrl+C

Copy

Ctrl+D

Send backwards

Ctrl+V

Paste

Ctrl+E

Sent to back

Ctrl+Shift+V

Paste formatting

Ctrl+3

Show or hide the  report explorer window

Delete

Delete the current element

Ctrl+2

Show or hide the  element properties window


In addition, you...

Considerations for different output formats


Depending on your output format, there may be differences in the rendering of your designed report. You will cover some of the more common issues faced when rendering to various output formats. When developing your report, make sure to preview the report in the formats you plan to render in, in order to avoid any surprises after the publishing of your report.

Cell output

When rendering to CSV, Excel, RTF, and in some respects to HTML, cell layout becomes an important issue. The Pentaho Reporting Engine does its best to determine the most appropriate cell layout for your report, but certain practices are necessary to ensure a nice looking report.

Alignment of elements is critical when dealing with cell output. Make sure all horizontal and vertical alignments are accurate. Even with subtle differences in horizontal or vertical locations, the report-to-cell-rendering algorithm can experience difficulties.

The following screenshot shows an illustrative...

Summary


In this chapter, you explored in-depth the ins and outs of design and layout of reports using the Pentaho Report Designer. You first learned about the various user interface components that make up the Report Designer. From there, you dove deep into each reporting band and its properties. You learned that each band may be accessed via the tree structure, and each band may display in the canvas as well as offering properties in the property editor.

You then took an exhaustive look at all the report elements. The chapter introduced you to the common properties seen throughout all the elements, along with displaying the dialogs that the various attributes present when editing. You also walked through utilizing the menu, toolbar, canvas, and shortcut keys to quickly arrange and layout your report. This included introducing shortcuts that make it easy to align and distribute groups of elements.

Finally, the chapter touched on additional details when dealing with common issues with the various...

lock icon
The rest of the chapter is locked
You have been reading a chapter from
Pentaho 8 Reporting for Java Developers
Published in: Sep 2017Publisher: PacktISBN-13: 9781788298995
Register for a free Packt account to unlock a world of extra content!
A free Packt account unlocks extra newsletters, articles, discounted offers, and much more. Start advancing your knowledge today.
undefined
Unlock this book and the full library FREE for 7 days
Get unlimited access to 7000+ expert-authored eBooks and videos courses covering every tech area you can think of
Renews at $15.99/month. Cancel anytime

Authors (2)

author image
Francesco Corti

Francesco Corti is an enthusiastic consultant in software solutions and loves working in developer, sales, and customers teams. Proud of the role of a software engineer, he is often involved in pre-sales presentations, public speaking, and IT courses. Developing software, designing architectures, and defining solutions in ECM/BPM and BI are his favorite areas of interest. He has completed dozens of projects, from very small ones to more complex ones, in almost 20 years of experience. A product evangelist at Alfresco, Francesco represents the famous open source ECM in the developer community. In addition to helping developers adopt Alfresco technologies, he often helps Alfresco to improve the developer experience through talks, articles, blogging, user demonstrations, recorded demonstrations, or the creation of sample projects. He is the inventor and principal developer of Alflytics (previously named Alfresco Audit Analytics and Reporting), the main business intelligence solution over Alfresco ECM, entirely based on the Pentaho suite. He authored the Pentaho Reporting video course with more than 40 videos and courses on the Pentaho Reporting Designer and SDK. Francesco has specialty and principal experiences in enterprise content management solutions with Alfresco ECM and Hyland OnBase (he is an OnBase certified installer); business process management solutions with Activiti, JBPM, and Hyland OnBase; data capture solutions with Ephesoft, Hyland OnBase, and custom software; record management solutions with O'Neil software and custom software (using Alfresco ECM and Hyland OnBase); and portal and collaboration with Liferay and MS SharePoint.
Read more about Francesco Corti