Reader small image

You're reading from  Learning Jupyter

Product typeBook
Published inNov 2016
Reading LevelIntermediate
PublisherPackt
ISBN-139781785884870
Edition1st Edition
Languages
Tools
Right arrow
Author (1)
Dan Toomey
Dan Toomey
author image
Dan Toomey

Dan Toomey has been developing application software for over 20 years. He has worked in a variety of industries and companies, in roles from sole contributor to VP/CTO-level. For the last few years, he has been contracting for companies in the eastern Massachusetts area. Dan has been contracting under Dan Toomey Software Corp. Dan has also written R for Data Science, Jupyter for Data Sciences, and the Jupyter Cookbook, all with Packt.
Read more about Dan Toomey

Right arrow

Chapter 2. Jupyter Python Scripting

Jupyter was originally IPython-an interactive version of Python to be used as a development environment. As such, most of the features of Python are available to you when developing your notebook.

In this chapter, we will cover the following topics:

  • Basic Python scripting

  • Python dataset access (from a library)

  • Python pandas

  • Python graphics

  • Python random numbers

Basic Python in Jupyter


In this chapter, we will be using Python scripts in a Jupyter Notebook. Jupyter does not interact with your scripts as much as it executes your script and records results. I think this is how Jupyter Notebooks have been extended to use other languages besides Python-the notebook just takes a script, runs it against a language engine, and records the output from the engine-all the while not really knowing what kind of script is being executed.

Similarly, I have not noticed any particular limitations when using Python in Jupyter. Some of the scripts I have run have taken a lot of time to run, used a lot of memory, opened new windows, and so on, all without failing. There are known issues running Python scripts that contain a __main__ execution loop and multithreaded applications.

We must open a Python section to our notebook to use Python coding. So, start your notebook, then, in the upper-right menu, select Python 2.

Note

I installed Jupyter in the Spring of 2016 on a...

Python data access in Jupyter


Now that we have seen how Python works in Jupyter, including the underlying encoding, then how does Python accessing a large dataset work in Jupyter?

I started another view for pandas using Python Data Access as the name. From here, we will read in a large dataset and compute some standard statistics on the data. We are interested in seeing how we use pandas in Jupyter, how well the script performs, and what information is stored in the metadata (especially if it is a larger dataset).

Our script accesses the iris dataset that's built into one of the Python packages. All we are looking to do is to read in a slightly large number of items and calculate some basic operations on the dataset. We are really interested to see how much of the data is cached in the IPYNB file

The Python code is as follows:

# import the datasets package
from sklearn import datasets
# pull in the iris data
iris_dataset = datasets.load_iris()
# grab the first two columns of data
X = iris_dataset...

Python pandas in Jupyter


One of the most widely used features of Python is pandas. It is a third-party library of data analysis packages that can be used freely. In this example, we will develop a Python script that uses pandas to see if there is any effect to using it in Jupyter.

I am using the Titanic dataset from http://www.kaggle.com/c/titanic-gettingStarted/download/train.csv. I am sure the same data is available from a variety of sources.

Here is the Python script that we want to run in Jupyter:

from pandas import *
training_set = read_csv('train.csv')
training_set.head()
male = training_set[training_set.sex == 'male']
female = training_set[training_set.sex =='female']
womens_survival_rate = float(sum(female.survived))/len(female)
mens_survival_rate = float(sum(male.survived))/len(male)

The result is we calculate the survival rates of the Titanic's passengers based on their sex.

We create a new notebook, enter the script into appropriate cells, include adding displays of calculated data...

Python graphics in Jupyter


How does Python graphics work in Jupyter?

I started another view for this named Python Graphics so as to distinguish the work from the previous work.

If we were to build a sample dataset of baby names and the number of births in a year of that name, we could then plot the data.

The Python coding is simple:

import pandas
import matplotlib
%matplotlib inline
baby_name = ['Alice','Charles','Diane','Edward']
number_births = [96, 155, 66, 272]
dataset = list(zip(baby_name,number_births))
df = pandas.DataFrame(data = dataset, columns=['Name', 'Number'])
df['Number'].plot()

The steps of the script are as follows:

  1. Import the graphics library (and data library) that we need.

  2. Define our data.

  3. Convert the data into a format that allows easy graphical display.

  4. Plot the data.

We would expect a graph of the number of births by baby name.

If we take the preceding script and place it into cells of our Jupyter Notebook, we get something that looks like the following screenshot:

I have...

Python random numbers in Jupyter


For many analyses, we are interested in calculating repeatable results. However, a lot of analysis relies on random numbers being used. In Python, you can set the seed for the random number generator to achieve repeatable results with the random_seed() function.

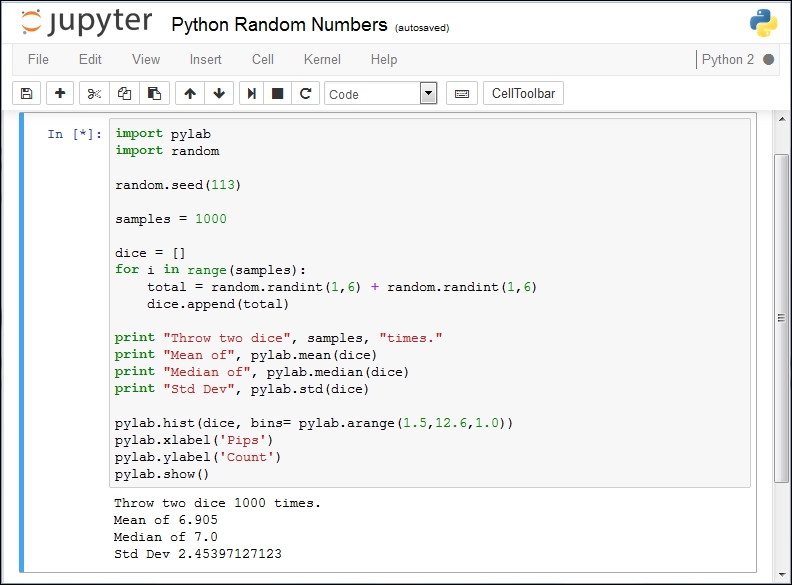
In this example, we simulate rolling a pair of dice and looking at the outcome.

The script we are using is this:

import pylab
import random
random.seed(113)
samples = 1000
dice = []
for i in range(samples):
    total = random.randint(1,6) + random.randint(1,6)
    dice.append(total)
pylab.hist(dice, bins= pylab.arange(1.5,12.6,1.0))
pylab.show()

Once we have the script in Jupyter and execute it, we have this result:

I had added some more statistics. I'm not sure I would have counted on such a high standard deviation. If we increased the number of samples, this would increase.

The resulting graph was opened in a new window, much as it would be if you ran this script in another Python development environment...

Summary


In this chapter, we walked through a simple notebook and the underlying structure. Then, we saw an example of using pandas. We looked at a graphics example. Finally, we looked at an example using random numbers in a Python script.

In the next chapter, we will learn all about R scripting in a Jupyter Notebook.

lock icon
The rest of the chapter is locked
You have been reading a chapter from
Learning Jupyter
Published in: Nov 2016Publisher: PacktISBN-13: 9781785884870
Register for a free Packt account to unlock a world of extra content!
A free Packt account unlocks extra newsletters, articles, discounted offers, and much more. Start advancing your knowledge today.
undefined
Unlock this book and the full library FREE for 7 days
Get unlimited access to 7000+ expert-authored eBooks and videos courses covering every tech area you can think of
Renews at $15.99/month. Cancel anytime

Author (1)

author image
Dan Toomey

Dan Toomey has been developing application software for over 20 years. He has worked in a variety of industries and companies, in roles from sole contributor to VP/CTO-level. For the last few years, he has been contracting for companies in the eastern Massachusetts area. Dan has been contracting under Dan Toomey Software Corp. Dan has also written R for Data Science, Jupyter for Data Sciences, and the Jupyter Cookbook, all with Packt.
Read more about Dan Toomey