Although any modern browser supports Scalable Vector Graphics (SVG) and has some kind of console, we strongly recommend you use Google Chrome for these examples. It comes bundled with developer tools that will allow you to very easily open, explore, and modify the code. If you are not using Google Chrome, please go to http://www.google.com/chrome and install Google Chrome.
Using the web browser as a development tool
Installing the sample code
Go to https://github.com/climboid/d3jsMaps and either clone the repo, if you are familiar with Git cloning, or simply download the zipped version. Once it is downloaded, make sure to extract the file if you have it zipped.
Use the command prompt or terminal to go to the directory where you downloaded your file. For instance, if you downloaded the file to your desktop, type in the following:
cd ~/Desktop/d3jsMaps
To start the server type the following:
http-server
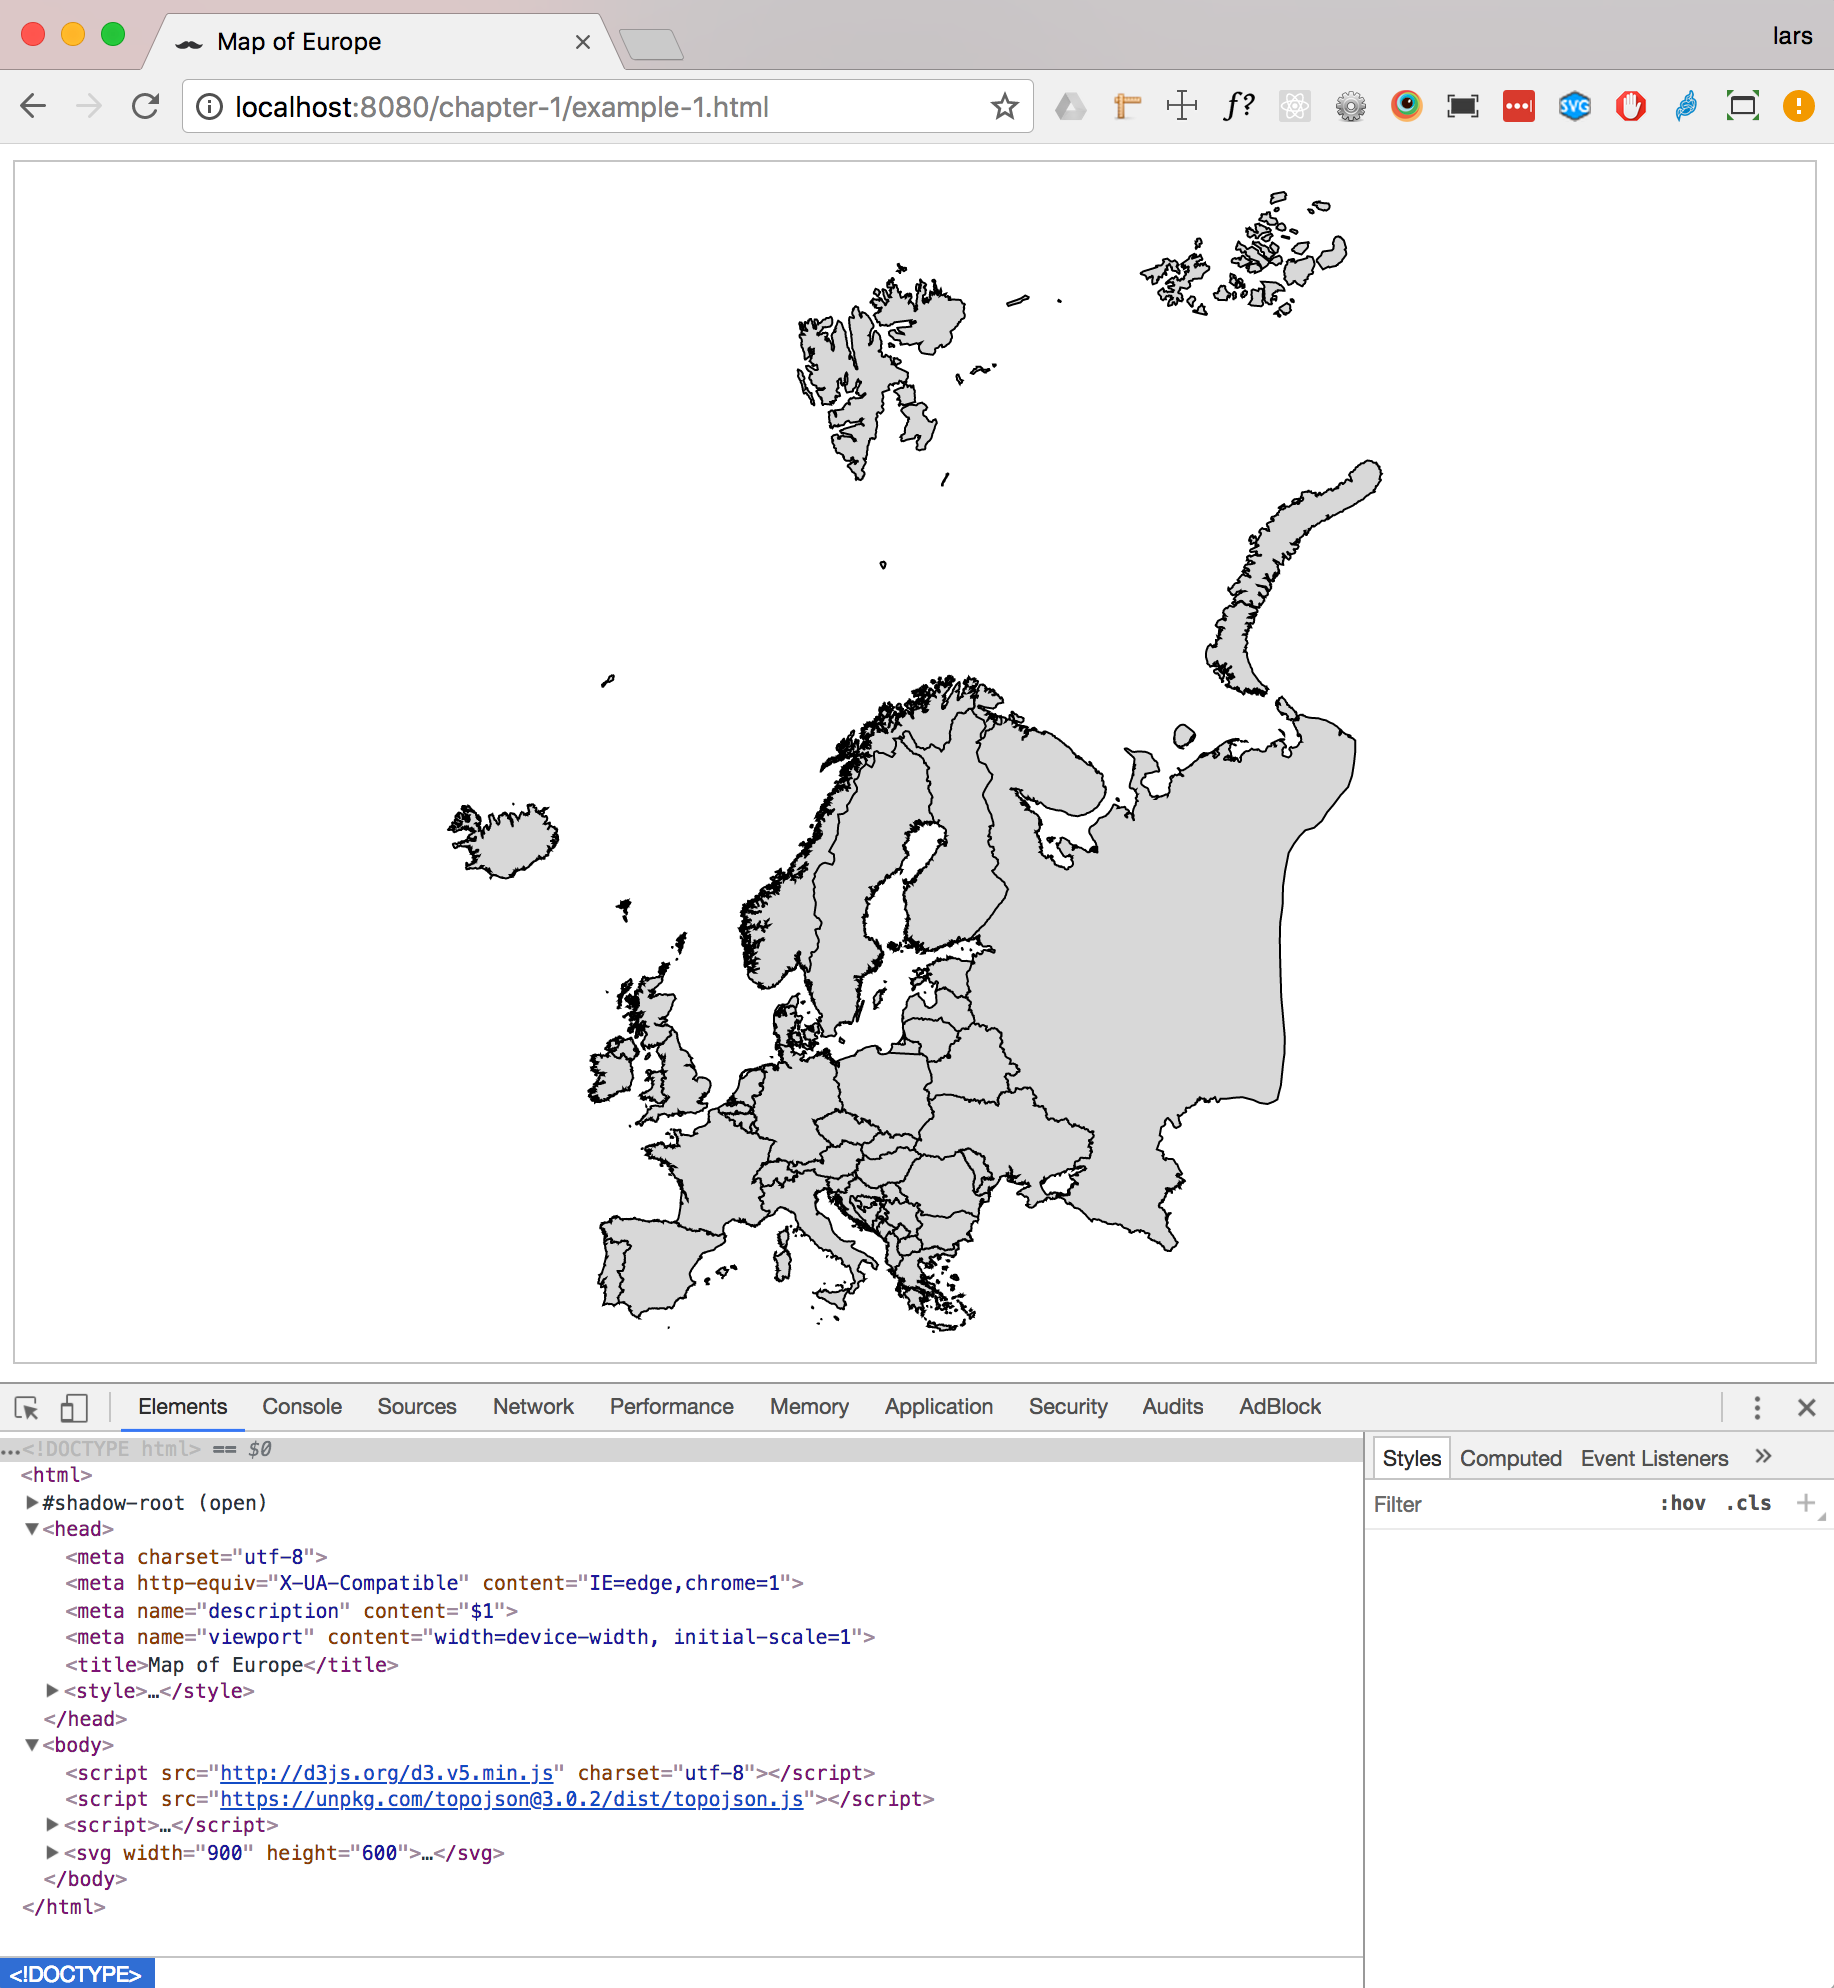
The last command will launch the simple server we installed previously for the supplied sample code. This means that, if you open your browser and go to http://localhost:8080/chapter-1/example-1.html, you should see a map
of Europe, similar to the one shown earlier.
Working with the developer tools
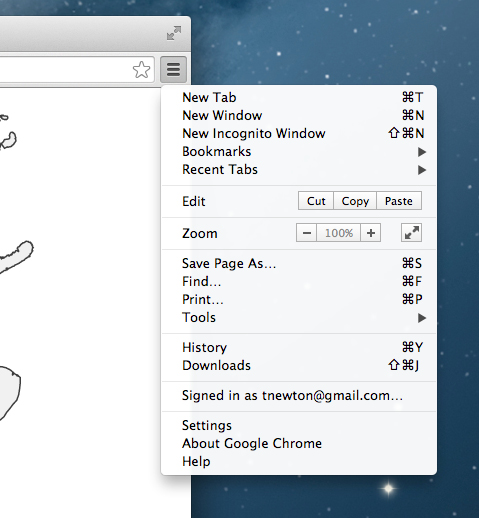
It's time to open the developer tools. In the top-right corner of the browser, you will see the icon as shown in the following screenshot:

This icon opens a submenu. Click on More Tools, then click on Developer tools.
A panel will open at the bottom of the browser, containing all the developer tools at your disposal.

Within developer tools, you have a series of tabs (Elements, Network, Sources, and so on). These tools are extremely valuable and will allow you to inspect different aspects of your code. For more information on the Chrome developer tools, please go to this link: https://developer.chrome.com/devtools/docs/authoring-development-workflow.
Since we are going to focus on the Elements tab, click on it if it is not already selected.
You should see something similar to the preceding screenshot; it will have the following code statement:
<svg width="812" height="584">
If you click on the SVG item, you should see it expand and display the path tag. The path tag will have several numbers and characters tied to a d attribute. These numbers are control points that draw the path. We will cover how the path is drawn in the next chapter and how path tags are used to create maps in Chapter 4, Creating a Map and Chapter 5, Click-Click Boom! Applying Interactivity to Your Map.
We also want to draw your attention to how the HTML5 application loads the D3 library. Again, in the Elements tag, after the SVG tag, you should see the <script> tag pointing to D3.js and TopoJSON:
<script src="http://d3js.org/d3.v5.min.js" charset="utf-8"></script>
<script src="https://unpkg.com/topojson@3.0.2/dist/topojson.js"></script>
If you click on the path located inside the SVG tag, you will see a new panel called the CSS inspector or the styles inspector. It shows and controls all the styles that are applied to a selected element, in this case, the path element.
These three components create a D3 visualization:
- HTML5 (the SVG and path elements)
- JavaScript (the D3.js library and map code)
- CSS (the styling of the HTML5 elements)
Creating maps and visualizations using these three components will be discussed and analyzed throughout the book.


