


Importing Data
Import is the default data connectivity mode for Power BI Desktop. Import models created in Power BI Desktop use the same in-memory, columnar compressed storage engine (VertiPaq) featured in Analysis Services Tabular 2016+ import models. Import mode models support the integration of disparate data sources (for example, SQL Server and DB2) and allow more flexibility in developing metrics and row-level security roles via full support for all DAX functions.
There are some limits for Import mode datasets, however. For example, Power BI Pro license users cannot publish Power BI Desktop files to shared capacity in the Power BI service that are larger than 1GB. Power BI Premium (dedicated, isolated hardware) supports datasets of 10GB in size and larger (with large datasets enabled, dataset size is limited by the Premium capacity size or the maximum size set by the administrator). With such large datasets, it is important to consider employing incremental refresh where only new and changed data is refreshed and imported, instead of the entire dataset being refreshed.
This recipe describes a process of using M and the Query Editor to develop the Import mode queries for a standard star-schema analytical model. A staging query approach is introduced as a means of efficiently enhancing the dimensions of a model. In addition, tips are included for using fewer resources during the refresh and avoiding refresh failures from revised source data. More details of these methods are included in other recipes in this chapter.
Getting ready
In this example, the DimProduct, DimProductSubcategory, and DimProductCategory tables from the AdventureWorksDW2019 database are integrated into a single import query. This query includes all product rows, only the English language columns, and user-friendly names. Many-to-one relationships have been defined in the source database.
To prepare for this recipe, do the following:
- Open Power BI Desktop.
- Create an Import mode data source query called AdWorksDW. This query should be similar to the following:
let Source = Sql.Database("localhost\MSSQLSERVERDEV", "AdventureWorksDW2019") in Source - Isolate this query in a query group called Data Sources.
- Disable loading of this query.
For additional details on performing these steps, see the Managing Queries and Data Sources recipe in this chapter.
How to import data
To implement this recipe, perform the following steps:
- Right-click AdWorksDW and choose Reference. This creates a new query that references the AdWorksDW query as its source.
- Select this new query and, in the preview data, find the DimProduct table in the Name column. Click on the Table link in the Data column for this row.
- Rename this query DimProduct.
- Repeat steps 1 – 3 for the DimProductCategory and DimProductSubcategory tables.
- Create a new query group called Staging Queries.
- Move the DimProduct, DimProductCategory, and DimProductSubcategory queries to the Staging Queries group.
- Disable loading for all queries in the Staging Queries group. Your finished set of queries should look similar to Figure 2.20.

Figure 2.20: Staging Queries
The italics indicate that the queries will not be loaded into the model.
- Create a new Blank Query and name this query Products.
- Open the Advanced Editor for the Products query.
- In the Products query, use the
Table.NestedJoinfunction to join theDimProductandDimProductSubcategoryqueries. This is the same function that is used if you were to select the Merge Queries option in the ribbon of the Home tab. A left outer join is required to preserve allDimProductrows, since the foreign key column toDimProductCategoryallows null values. - Add a
Table.ExpandColumnsexpression to retrieve the necessary columns from theDimProductSubcategorytable. The Products query should now have the following code:let ProductSubCatJoin = Table.NestedJoin( DimProduct,"ProductSubcategoryKey", DimProductSubcategory,"ProductSubcategoryKey", "SubCatColumn",JoinKind.LeftOuter ), ProductSubCatColumns = Table.ExpandTableColumn( ProductSubCatJoin,"SubCatColumn", {"EnglishProductSubcategoryName","ProductCategoryKey"}, {"Product Subcategory", "ProductCategoryKey"} ) in ProductSubCatColumnsThe
NestedJoinfunction inserts the results of the join into a column (SubCatColumn) as table values. The second expression converts these table values into the necessary columns from the DimProductSubcategory query and provides the simpleProduct Subcategorycolumn name, as shown in Figure 2.21.
Figure 2.21: Product Subcategory Columns Added
The query preview in the Power Query Editor will expose the new columns at the far right of the preview data.
- Add another expression beneath the
ProductSubCatColumnsexpression with aTable.NestedJoinfunction that joins the previous expression (the Product to Subcategory join) with theDimProductCategoryquery. - Just like step 8, use a
Table.ExpandTableColumnfunction in a new expression to expose the required Product Category columns.), ProductCatJoin = Table.NestedJoin( ProductSubCatColumns,"ProductCategoryKey", DimProductCategory,"ProductCategoryKey", "ProdCatColumn",JoinKind.LeftOuter ), ProductCatColumns = Table.ExpandTableColumn( ProductCatJoin,"ProdCatColumn", {"EnglishProductCategoryName"}, {"Product Category"} ) in ProductCatColumnsBe certain to add a comma after the
ProductSubCatColumnsexpression. In addition, be sure to change the line beneath theinkeyword toProductCatColumns.The expression
ProductCatJoinadds the results of the join toDimProductCategory(the right table) to the new column (ProdCatColumn). The next expression,ProductCatColumnsadds the required Product Category columns and revises theEnglishProductCategoryNamecolumn toProduct Category. A left outer join was necessary with this join operation as well since the product category foreign key column onDimProductSubcategoryallows null values. - Add an expression after the
ProductCatColumnsexpression that selects the columns needed for the load to the data model with aTable.SelectColumnsfunction. - In addition, add a final expression to rename these columns via
Table.RenameColumnsto eliminate references to the English language and provide spaces between words.), SelectProductColumns = Table.SelectColumns(ProductCatColumns, { "ProductKey", "EnglishDescription", "EnglishProductName", "Product Subcategory", "Product Category" } ), RenameProductColumns = Table.RenameColumns(SelectProductColumns, { {"EnglishDescription", "Product Description"}, {"EnglishProductName", "Product Name"} } ) in RenameProductColumns
Be certain to add a comma after the ProductCatColumns expression. In addition, change the line beneath the in keyword to RenameProductColumns.
The preview in the Power Query Editor for the Products query should now be similar to that shown in Figure 2.22.
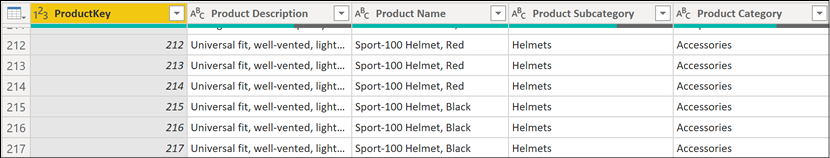
Figure 2.22: Product Query Results
It is not necessary to rename the ProductKey column since this column will be hidden from the reporting layer. In practice, the product dimension would include many more columns. Closing and applying the changes results in only the Products table being loaded into the model.
The denormalized Products table now supports a three-level hierarchy in the Power BI Desktop model to significantly benefit reporting and analysis.

Figure 2.23: Product Hierarchy
How it works
The default join kind for Table.NestedJoin is a left outer join. However, as other join kinds are supported (for example, inner, anti, and full outer), explicitly specifying this parameter in expressions is recommended. Left outer joins are required in the Products table example, as the foreign key columns on DimProduct and DimProductSubcategory both allow null values. Inner joins implemented either via Table.NestedJoin or Table.Join functions are recommended for performance purposes otherwise. Additional details on the joining functions as well as tips on designing inline queries as an alternative to staging queries are covered in the Combining and Merging Queries recipe in this chapter.
When a query joins two tables via a Table.NestedJoin or Table.Join function, a column is added to the first table containing a Table object that contains the joined rows from the second table. This column must be expanded using a Table.ExpandTableColumn function, which generates additional rows as specified by the join operation.
Once all rows are generated by the join and column expansion operations, the specific columns desired in the end result can be specified by the Table.SelectColumns operation; these columns can then be renamed as desired using the Table.RenameColumns function.
There's more...
Using Import mode, we can do many things to enhance our queries to aid in report development and display. One such example is that we can add additional columns to provide automatic sorting of an attribute in report visuals. Specifically, suppose that we wish for the United States regional organizations to appear next to one another by default in visualizations. By default, since the Organization column in the DimOrganization table in AdventureWorksDW2019 is a text column, the Central Division (a part of the USA), appears between Canada and France based upon the default alphabetical sorting of text columns. We can modify a simple query that pulls the DimOrganization table to add a numeric sorting column. To see how this works, follow these steps:
- Using the same Power BI file used for this recipe, open the Power Query Editor, right-click the AdWorksDW query, and select Reference.
- Choose the DimOrganization table and rename the query to DimOrganization.
- Open the Advanced Editor window for the DimOrganization query.
- Add a
Table.Sortexpression to the import query for the DimOrganization dimension. The columns for the sort should be at the parent or higher level of the hierarchy. - Add an expression with the
Table.AddIndexColumnfunction that will add a sequential integer based on the table sort applied in the previous step. The completed query should look something like the following:let Source = AdWorksDW, dbo_DimOrganization = Source{[Schema="dbo",Item="DimOrganization"]}[Data], OrgSorted = Table.Sort( dbo_DimOrganization, { {"ParentOrganizationKey", Order.Ascending}, {"CurrencyKey", Order.Ascending} } ), OrgSortIndex = Table.AddIndexColumn(OrgSorted,"OrgSortIndex",1,1) in OrgSortIndex - Finally, with the Ctrl key pressed, select the OrganizationKey, OrganizationName, and OrgSortIndex columns by clicking their column headers. Right-click on the OrgSortIndex column and choose to Remove Other Columns. The preview data should now show as presented in Figure 2.24.

Figure 2.24: Modified Organization Dimension Query
With this expression, the table is first sorted by the ParentOrganizationKey column and then by the CurrencyKey column. The new index column starts at the first row of this sorted table with an incremental growth of one per row. The net effect is that all of the US divisions are grouped together at the end of the table.
We can now use this new index column to adjust the default alphanumeric sorting behavior of the OrganizationName column. To see how this works, perform the following steps:
- Choose Close & Apply to exit Power Query Editor to load the DimOrganization table.
- In the Data View, select the
OrganizationNamecolumn. - From the Column tools tab, set the Sort by column drop-down to the OrgSortIndex column.

Figure 2.25: Sort By in Data View
- Finally, right-click on the OrgSortIndex column and select Hide in report view.
Visuals using the OrganizationName column will now sort the values by their parent organization such that the USA organizations appear together (but not alphabetically).
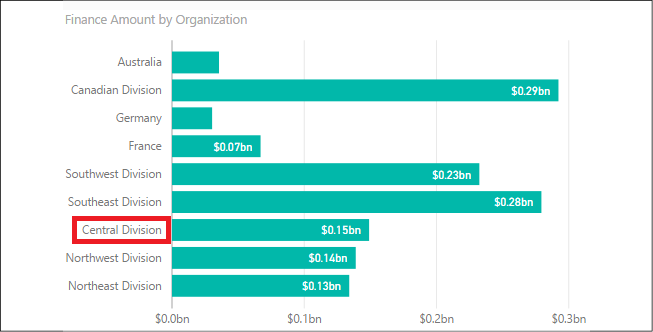
Figure 2.26: Organization automatically sorted
See also
- Dataset modes in the Power BI service: http://bit.ly/30P2HKF
- Data reduction techniques for Import modeling: http://bit.ly/30RsMZI