
Profiling Source Data
The topic of data quality deals with the overall utility of datasets, and the ability to easily process and use the data for certain purposes, including analytics and reporting. Data quality is an essential component of data governance, ensuring that business data is accurate, complete, consistent, and valid. Good data quality is an essential element of any data analytics and reporting endeavor. Poor data quality can lead to incorrect analysis and decisions by the business—hence the phrase "garbage in, garbage out". Luckily, the Power Query Editor provides powerful data profiling tools to assist in quickly determining the quality of the data with which you are working. This recipe demonstrates how to unlock the powerful tools within the Power Query Editor for profiling columns and gaining a sense of the quality of the data being worked upon.
Getting ready
To get ready for this recipe, import the FactCallCenter table from the AdventureWorksDW2019 database by doing the following:
- Open Power BI Desktop and choose Transform data from the ribbon of the Home tab to open the Power Query Editor.
- Create an Import mode data source query called
AdWorksDW. This query should be similar to the following:let Source = Sql.Database("localhost\MSSQLSERVERDEV", "AdventureWorksDW2019") in Source - Isolate this query in a query group called Data Sources.
- Right-click
AdWorksDWand choose Reference, select the FactFinance table in the data preview area, and rename this query FactFinance. - Move the FactFinance query to the Other Queries group.
For additional details on performing these steps, see the Managing Queries and Data Sources recipe in this chapter.
How to Profile Source Data
To implement this recipe, perform the following steps:
- Select the FactFinance query.
- In the View tab, check the box for Column profile in the Data Preview area of the ribbon.
- Select a column to view the column statistics similar to those in Figure 2.44:

Figure 2.44: Column profile information
How it works
By default, the M query engine pulls the first 1,000 rows of data from the specified data source. This is the data used in the data preview area. The default of using only the first 1,000 rows of data can be changed by clicking on Column profiling based on top 1000 rows in the status bar in the bottom right and choosing Column profiling based on the entire data set. Statistics are collected on each column in the data source. When the Column profile feature is enabled, selecting a column causes column statistics and value distribution to display in the bottom half of the data preview area, including alongside this error counts, the number of distinct and unique values, minimum values, maximum values, and additional information that depends upon the data type of the column, as shown in Figure 2.44.
There's more...
Additional data quality dialogs are available in the Power Query Editor. From the View tab, check the box next to Column quality and Column distribution. Small visuals appear under the column headings. Hovering your mouse over this area provides a pop-up dialog that provides suggested actions as well as common data cleansing activities via the ellipsis menu (…).
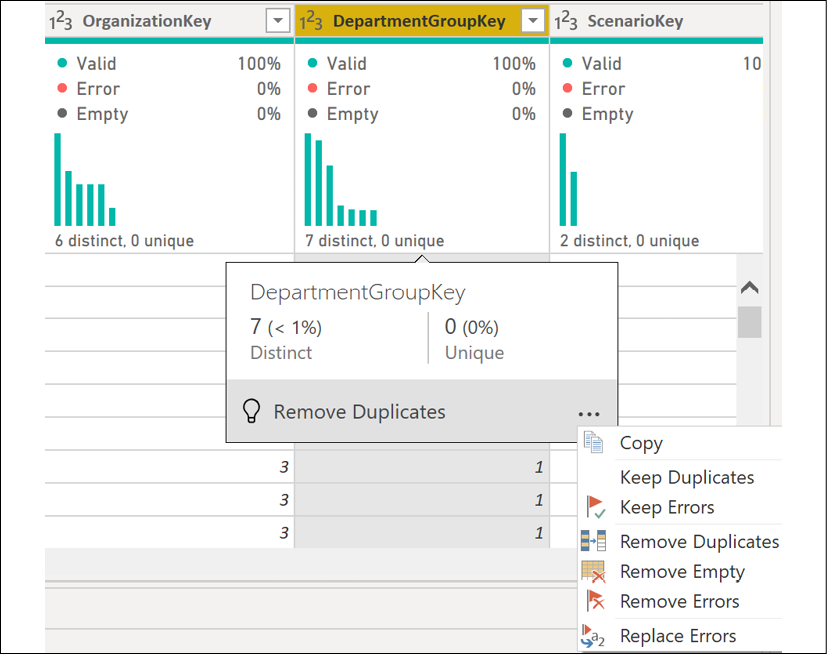
Figure 2.45: Column quality and Column distribution visuals
See Also
- Using the data profiling tools: http://bit.ly/3c46s5g