


Plotting X, Y points from a table
It is not unusual to get data from outside sources that is nothing more than a table with some information that includes X and Y data. This may come from a surveyor, someone who collected data with their smartphone, or some other source. The data might be a spreadsheet, a text file, a CSV file, or even a database table.
If the data includes coordinates for the location, you can turn these into points within a map. This is called an event layer. The coordinates can be in any known coordinate system if they are all the same, meaning that all the coordinates for all the records in the table must be listed in the same coordinate system.
In this recipe, you will plot the locations of crimes from a standalone database table. This table contains several records, each of which has a latitude and longitude coordinate. You will use that information to plot the location.
Getting ready
While not required, it is recommended that you complete the recipes in Chapter 1 before starting this one to ensure you have basic skills in using ArcGIS Pro and understand the terminology associated with the application. This recipe does not require any previous recipes to have been completed. The sample data must be installed before you continue. This recipe can be completed with all license levels of ArcGIS Pro.
How to do it…
You will start by working through the process required to plot the locations of events listed in a standalone table found in a geodatabase:
- Start ArcGIS Pro and open the
Plot XY from Table.aprxproject located inC:\Student\ArcGISPro3Cookbook\Chapter2. Click the Open another project button and navigate toC:\Student\ArcGISPro3Cookbook\Chapter2. Select the desired project file (.aprx) and click OK.The project will open with the Trippville map being displayed. This map contains two layers –
City LimitandParcels. Next, you will add the standalone table that contains the data you need to plot and examine. - In the Catalog pane, expand the
Databasesfolder to reveal its contents. - Expand the
Trippville_GIS.gdbgeodatabase so that you can see what it contains. - Scroll through the contents of the
Trippville_GIS.gdbgeodatabase until you see theCrimes_2023standalone table. Right-click on the table and select Add To Current Map, as shown in the following screenshot:
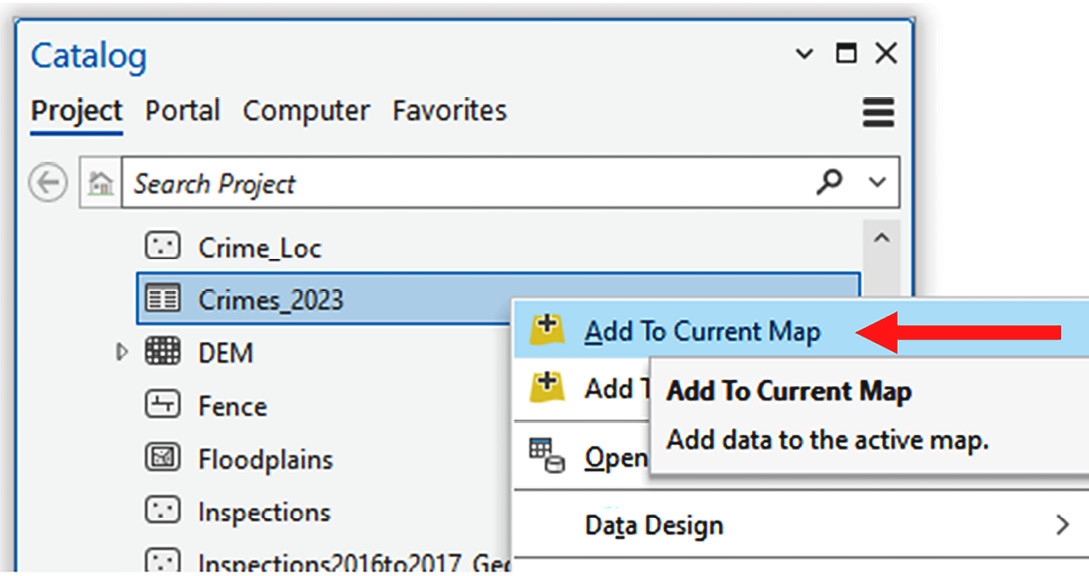
Figure 2.18 – Adding a table to a map from the Catalog pane
When added successfully, the table should appear at the bottom of the Contents pane.
Information
A standalone table is any table that is not directly associated with spatial data. This means it does not initially include a spatial component that is automatically displayed in a map. A standalone table might contain fields that hold coordinates, addresses, or other location information that can be used to display spatial information but requires additional steps to do so. Tables that are directly associated with spatial data are called attribute tables.
- In the Contents pane, right-click on the
Crimes_2023table you just added and select Open from the menu that appears. Take a moment to review the fields and data contained in the table so that you know what information is available for you to work with.You should see six different fields. The most important are the two at the end – Lat and Long. These are the coordinates that identify the location of each crime. You will use those to create points on your map that show the location.
- Close the
Crimes_2023table by clicking the small X in the tab at the top of the table. - Right-click the
Crimes_2023table in the Contents pane and select Create Points From Table, then XY Table To Point, as shown in the following screenshot:
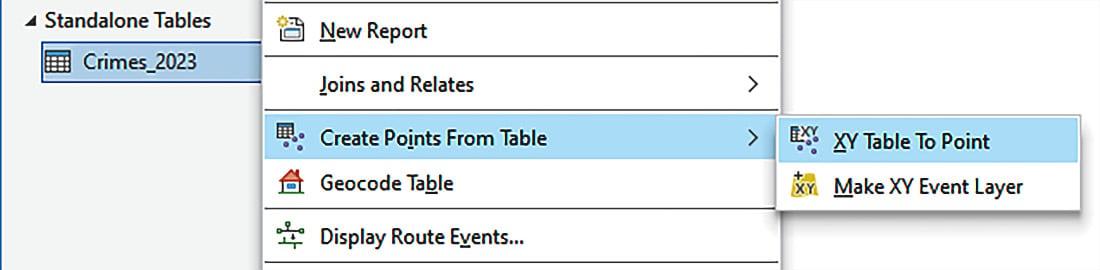
Figure 2.19 – Accessing the XY Table To Point tool
- The XY Table to Point tool window should open. It will automatically populate with the required variables. Verify that yours looks as follows. If it does, click OK. If not, make the appropriate adjustments:
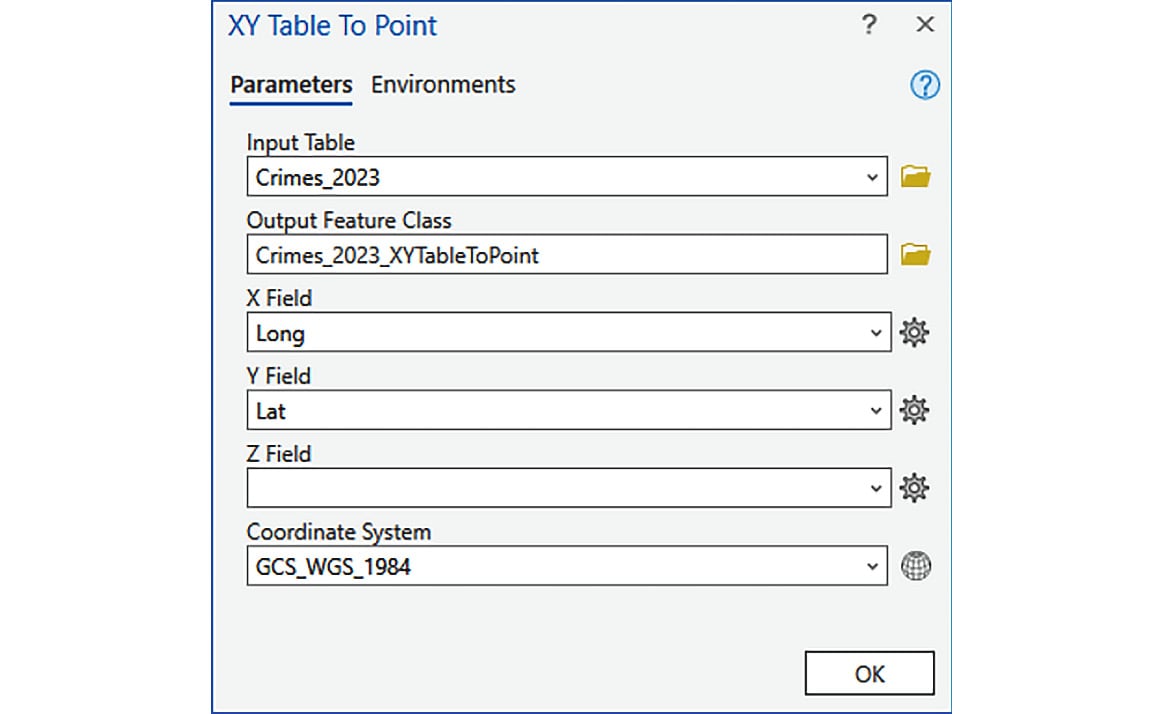
Figure 2.20 – The XY Table To Point tool with completed parameters
A new layer will appear in your map named Crimes_2023_XYTableToPoint. This is the results of the XY Table to Point tool. It generated a new point layer based on the latitude and longitude coordinates that were in the standalone Crimes_2023 table. But it did more than that. You will explore the results later to see exactly what the tool created.
- Right-click on the
Crimes_2023_XYTableToPointlayer and select Attribute Table from the menu that appears. This will open the attribute table for the new layer you created. - Take a moment to review the data contained in the attribute table you just opened. Compare it to the standalone
Crimes_2023table.As you can see, the data in the two tables is very similar. The attribute table contains an additional field called Shape.
- In the Catalog pane, look at the contents of the
Trippville_GIS.gdbgeodatabase. If needed, expand it so that you can see its contents. - Scroll down and see whether you can locate a new feature class named
Crimes_2023_XYTableToPoint. - In the Contents pane, double-click on the
Crimes_2023_XYTableToPointlayer to open its properties. - Select Source in the left panel of the Layer Properties window.
- Examine the values in the right panel for the
DatabaseandNameparameters.As you can see, the new layer references back to the new feature class you saw in the
Trippville_GIS.gdbgeodatabase. The XY Table To Point tool not only created a new layer but also created a new feature class in the geodatabase. - Close the Layer Properties window by clicking on the OK button.
- Close all the tables you might have open.
- Save your project and close ArcGIS Pro.
You have successfully created a new layer using data stored in a standalone table. This same process will work for data stored in other files, such as Excel spreadsheets, text files, or CSV files.
How it works…
In this recipe, you created points on a map showing the location of crimes using a standalone database table. You did this by adding the table to your map by right-clicking it in the database and selecting Add To Current Map.
Once you added the table to the map, you viewed the table to ensure it included the coordinate values for each record. This was as simple as opening the table and looking at the data it contained.
Lastly, you right-clicked the table in the Contents pane and selected XY Table to Point. This opened the XY Table to Point tool window displaying all the tool parameters. Because your table used several default fields, it automatically populated the required variables. Once this tool ran, a new point layer appeared in the map showing the actual location of the crimes from the table.