


Adding a layer from ArcGIS Online
One of the powerful capabilities of ArcGIS Pro is its integration with Esri’s cloud solution, ArcGIS Online. ArcGIS Online allows users to share GIS content, including maps, data, and applications, with others. ArcGIS Pro’s integration with this cloud solution allows users to access data and maps quickly and easily so that they can display, edit, and analyze them. It does this by utilizing web services.
ArcGIS Online contains a vast array of data that can help enrich your maps. A good example of this is Esri’s catalog of basemaps. At the time of writing, ArcGIS Online hosts around 30 basemaps that you can use in ArcGIS Pro as backdrops for your maps and data. But that just scratches the surface. ArcGIS Online is not just limited to data published by Esri. Many organizations have published and shared data and maps that you can also access and use. To learn more about ArcGIS Online and its capabilities, go to https://www.esri.com/en-us/arcgis/products/arcgis-online/overview.
In this recipe, the city of Trippville’s water system superintendent has asked you to review data that a consultant working for the city has created. The consultant has published the data via ArcGIS Online so that you can view it. You must add the data that the consultant published to ArcGIS Online to a map in ArcGIS Pro.
Getting ready
This recipe will require you to have an ArcGIS Online Named User account or higher in addition to your ArcGIS Pro license. If your organization does not have an ArcGIS Online Named User account that can be assigned to you, you can sign up for a free trial at https://www.esri.com/en-us/arcgis/products/arcgis-online/trial. As with all the recipes in this book, you must also have the sample data installed. You will also need to ensure you have a connection to the internet.
You don’t need to have completed the previous recipe to complete this one. However, it is recommended that you complete the recipes in Chapter 1 to ensure you have a foundational understanding of terminology and the ArcGIS Pro interface.
How to do it…
Follow these steps to learn how to add layers that are stored in ArcGIS Online to a map:
- Start ArcGIS Pro from the Windows Start menu or the shortcut on your taskbar or desktop.
- In the ArcGIS Pro Start window, click on the Open another project button, as shown here:
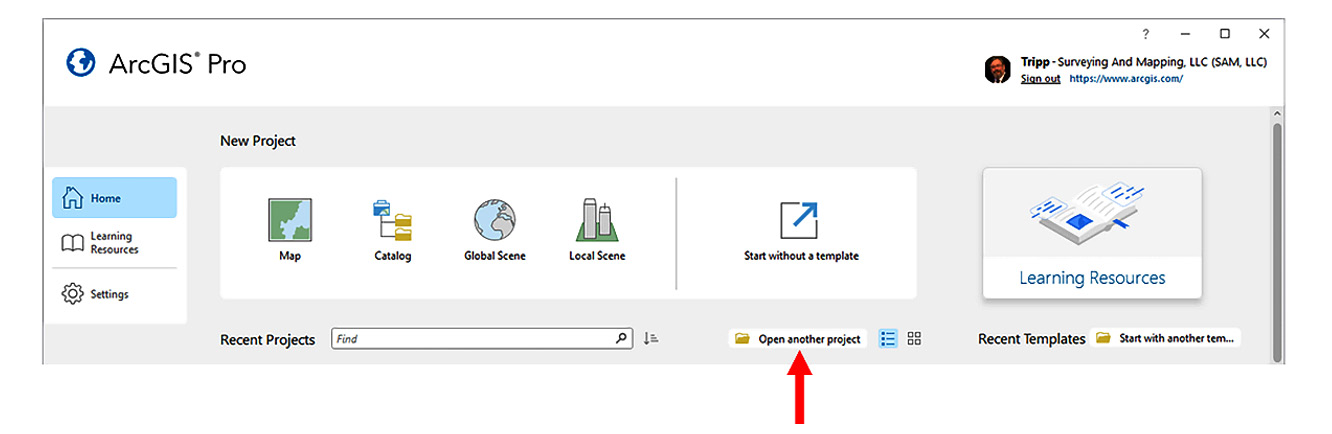
Figure 2.12 – Open another project
- In the Open Project window, expand the Computer option in the left panel. Then, in the right panel, scroll down and double-click on the C: drive. It may be labeled Local Disk, Local Drive, or OS.
- Double-click on the
Studentfolder, followed by theArcGISPro3Cookbookand Chapter 2 folders. - Double-click on the
AGOL Layersfolder and select theAGOL Layersproject file. Then, click the OK button to open the project.The project should open in ArcGIS Pro and display a map containing the
City_Limit,Parcels, World Topographic Map, andWorld Hillshadelayers. TheWorld Topographic MapandWorld Hillshadelayers are from ArcGIS Online as part of theTopographicbasemap.
Verifying and changing the ArcGIS Online-hosted basemap
Now, you must verify where the Topographic basemap is coming from and then change the basemap to another one to help verify the consultants’ water data:
- In the Contents pane, click on the List by Source button, which resembles a short cylinder, so that you can see where the various layers in the map are sourced.
- Locate the
World Topographic MapandWorld Hillshadelayers in the Contents pane. Note where the sources for these layers are.As shown in the following screenshot, both of these layers reference two different web services.
World Topographic Mappoints to a web map that is hosted via arcgis.com, whereasWorld Hillshadepoints to a feature service that is hosted via arcgisonline.com. Both URLs are part of ArcGIS Online:
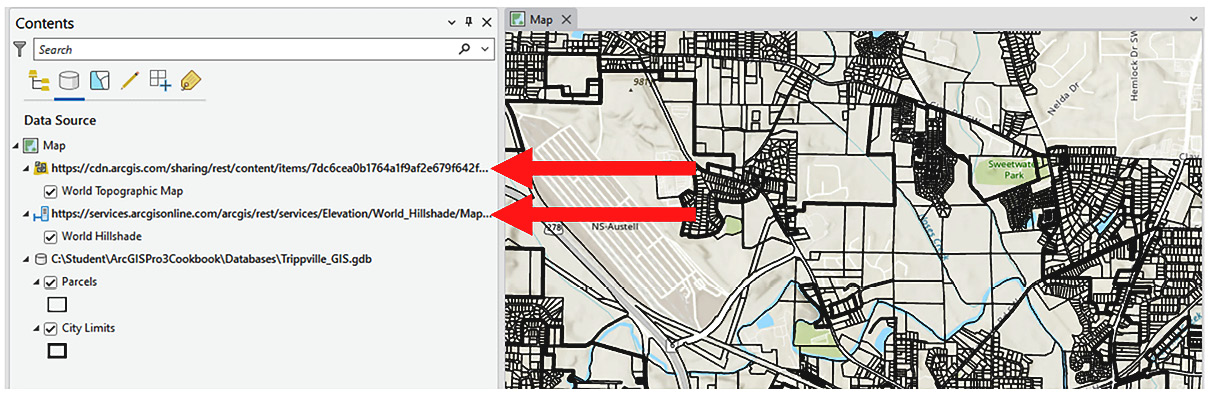
Figure 2.13 – Basemap sources from ArcGIS Online
As basemaps, you cannot change their display settings, edit their data, or use them for analysis. Basemaps just help provide context for the rest of your layers. You can, however, change the basemap being used in your map. You will do that now.
To help verify the water system data created by the consultant, you will switch to the Imagery basemap.
- Active the Map tab in the ribbon. Then, click on the Basemap button to display the basemap gallery.
- Select the Imagery option from the gallery that appears. This will change the basemap that’s used in the map to one that shows aerial photography provided by Esri, as shown in the following screenshot:
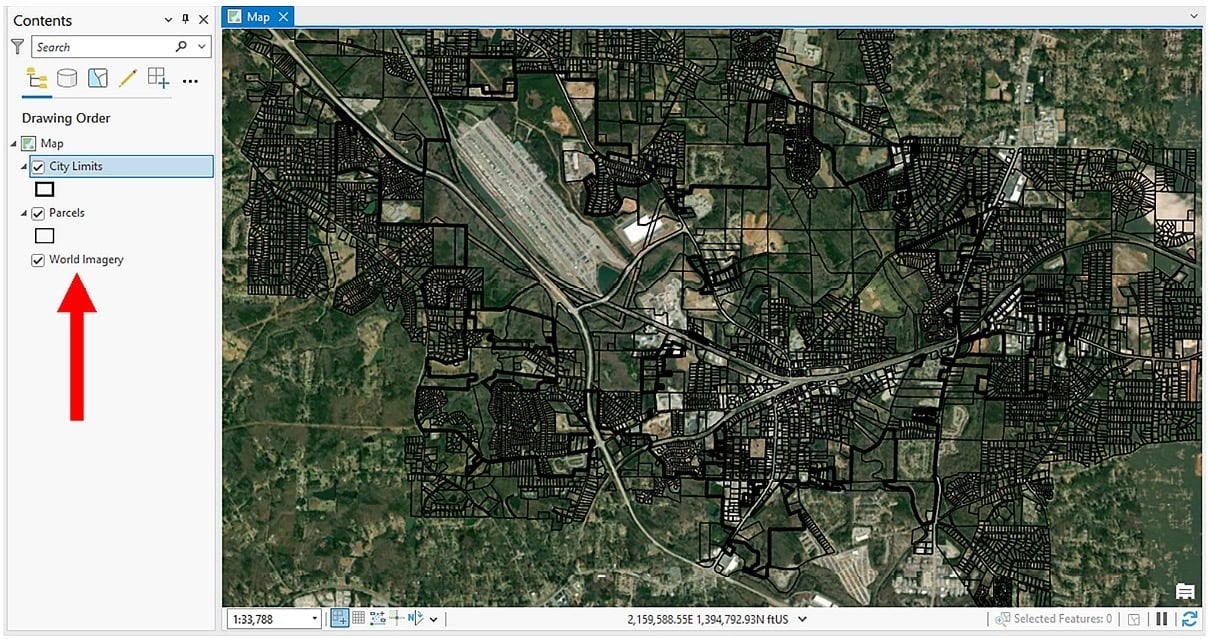
Figure 2.14 – Basemap changed to World Imagery from ArcGIS Online
As you saw in the gallery, Esri provides a wide range of basemaps you can use in your maps. These are available to all ArcGIS Pro users as part of your license.
Adding other layers from ArcGIS Online
Basemaps are just the start of the data you can access via ArcGIS Online. Next, you will add layers for the city of Trippville that were created by the city’s consultant and hosted in ArcGIS Online:
- In the Catalog pane, select the Portal tab located near the top of the pane and to the right of the Project tab.
- Click on the ArcGIS Online button, which resembles a cloud, as shown here:
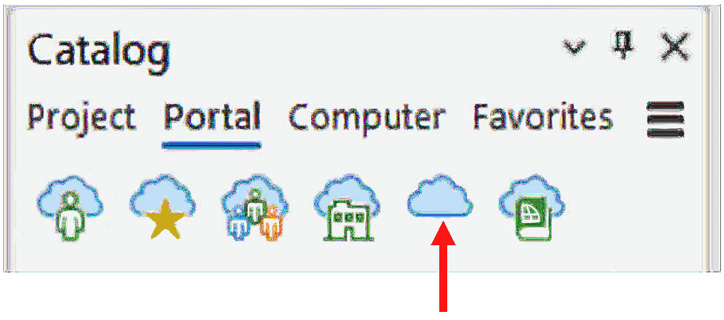
Figure 2.15 – The ArcGIS Online button in the Catalog pane
- Verify that the Content option is selected. Then, in the Search ArcGIS Online cell, type
Trippville Water System Map 2023and press Enter to run the search. - Right-click the
Trippville Water System Map 2023feature service under Search Results and select Add To Current Map, as shown in the following screenshot:
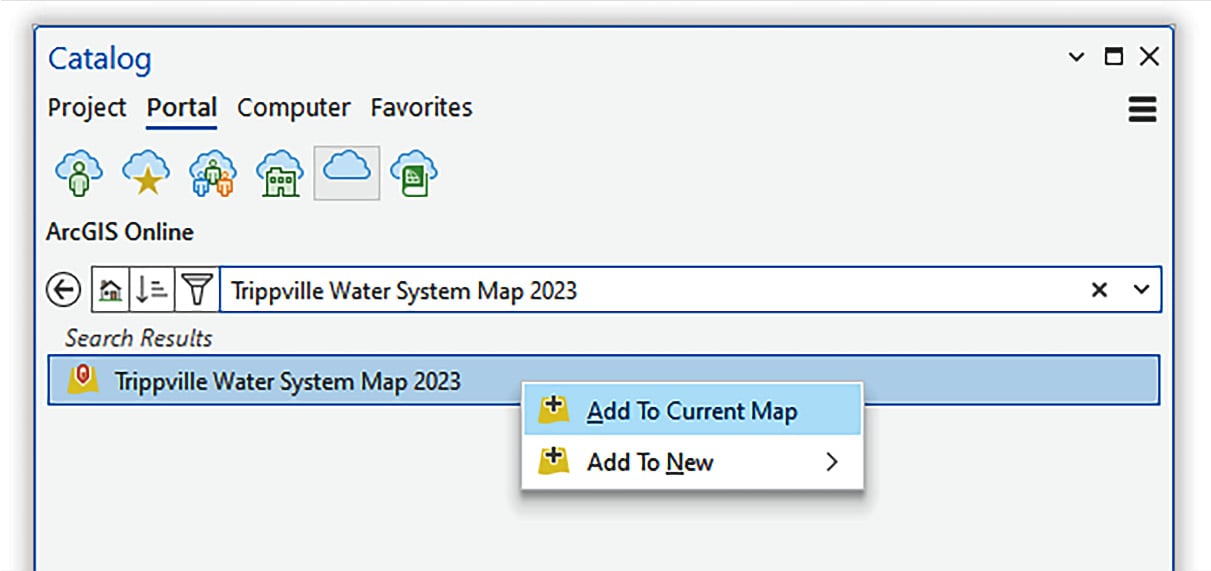
Figure 2.16 – Adding an ArcGIS Online feature service as a layer to the current map
You should now see a new group layer that’s been added to your map called Trippville Water System Map 2023. This contains the data that was created and shared by the consultant. This is hosted in the ArcGIS Online cloud solution from Esri and is displayed on your computer.
Changing the symbology of an ArcGIS Online hosted layer
To help you evaluate the data, you will adjust the symbology for the Water Lines layer located within the group layer you just added:
- Expand the
Trippville Water System Map 2023group layer in the Contents pane so that you can see the layers that are included. - Select the
Water Lineslayer. Then, activate the Feature Layer tab in the ribbon. - Click on the Import button located in the Drawing group.
- The Input Layer parameter should automatically be set to
Water Linesbecause you have it selected in the Contents pane. Set the Symbology Layer parameter by clicking on the Browse button. - In the Symbology Layer window, click on the Folders option located below Project in the left panel of the window.
- In the right panel, double-click on
AGOL Layersto open it. Then, select theWater Lines by Size and Material.lyrxlayer file and click OK. - Verify that your Import Symbology tool matches what’s shown in the following screenshot and click OK:
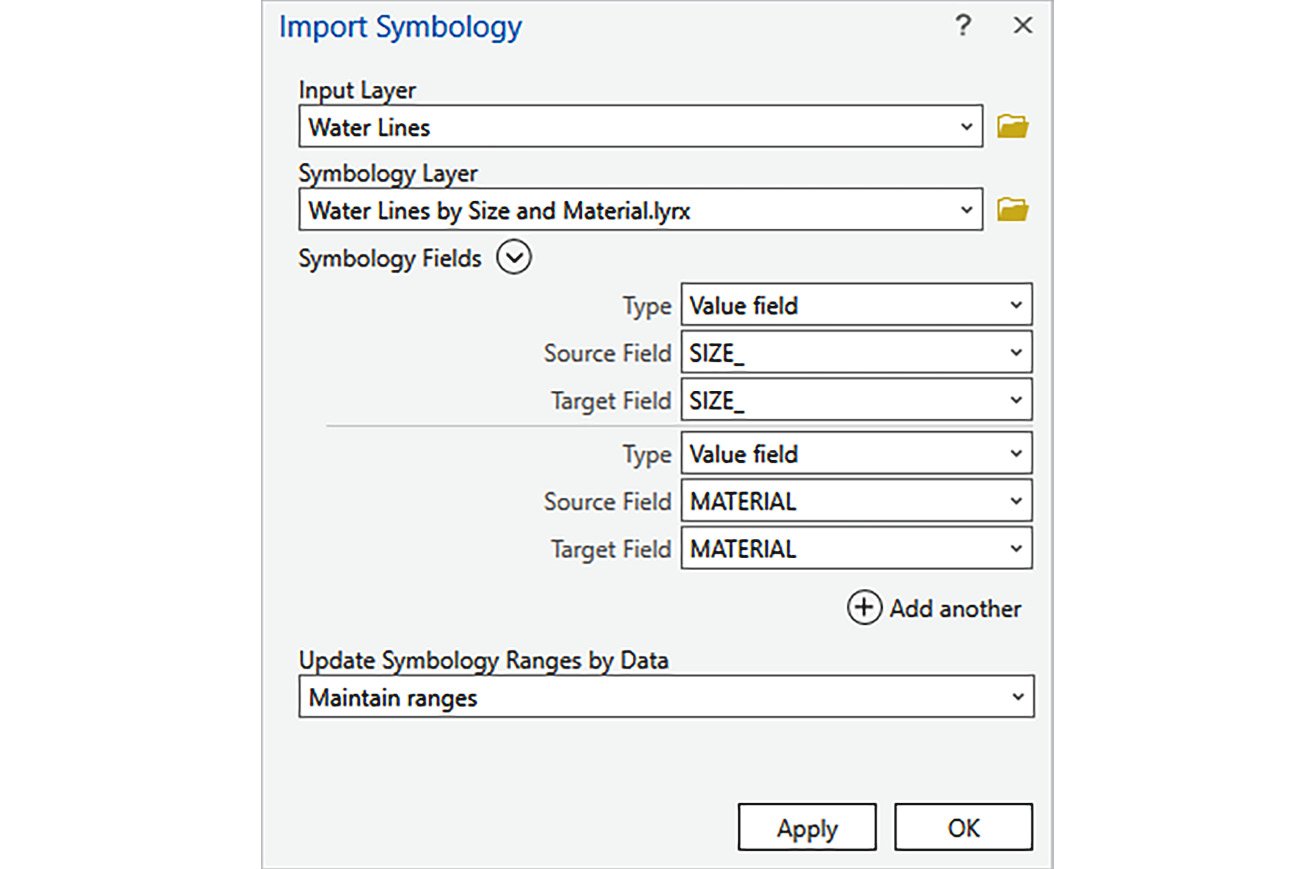
Figure 2.17 – The Import Symbology tool with completed parameters
When the tool finishes running, the symbology for the Water Lines layer will change and show the pipe size and material for each section of the water line. Symbolizing the water lines in this fashion will allow you or others to easily assess the completeness of the data and find possible errors.
Even though data is hosted in ArcGIS Online, you can interact with it just like you can data stored within your system or network, depending on the type of web service and your permissions.
Information
ArcGIS Online allows users to publish and share many types of content. From a map perspective, two basic types of web services can be published and shared – a Map Service and a Feature Service.
Map Service: A rasterized version of the published map that allows data to be displayed, queried, and printed. It does not allow data editing.
Feature Service: A vector version of the published map that allows all the functionality of a map service, plus it allows data editing.
There is a lot more to web services and layers. To learn more, go to https://pro.arcgis.com/en/pro-app/latest/help/sharing/overview/introduction-to-sharing-web-layers.htm.
Save your project and close ArcGIS Pro.
You have just added a new group layer to your map that references data stored in ArcGIS Online and changed how one of the individual layers within the group layer was displayed.
How it works…
In this recipe, you got to experience some of the basic integrations between ArcGIS Pro and ArcGIS Online by changing the basemap included in the map and adding new layers that reference data stored in ArcGIS Online. You started by verifying the source for the Topography basemap included in the map. You did this by clicking on the List by Source button in the Contents pane. That allowed you to see that the Topography basemap source referenced different URLs – that is, arcgis.com and arcgisonline.com. Then, you changed the basemap to World Imagery, which is also hosted by Esri in ArcGIS Online.
Next, you added data to the map that represented the water system for the city of Trippville, which was also stored in ArcGIS Online. You did this by going to the Catalog pane and selecting the Portal tab. Next, you selected the ArcGIS Online button and performed a search for the data you needed. Then, you right-clicked on the returned result and selected Add To Current Map. This created a new group layer that contained several individual layers, including Water Tank, Water Meters, Fire Hydrants, and Water Lines. Lastly, you imported a layer file that changed the symbology for the Water Lines layer so that you could see the pipe size and material for each pipe segment.


