

In this recipe, we present the Automatic Database Diagnostic Monitor, a tool which analyzes the data collected by AWR to diagnose the cause of a performance problem, providing advice on how to solve the issue.
ADDM is enabled by default in Oracle Database 11g; it depends upon two configuration parameters of the init.ora file, STATISTICS_LEVEL and CONTROL_MANAGEMENT_PACK_ACCESS. The value for these parameters should be TYPICAL or ALL for the former and DIAGNOSTIC or DIAGNOSTIC+TUNING for the latter. To show the current parameter values, we can use the following statement:
SHOW PARAMETER STATISTICS_LEVEL
SHOW PARAMETER CONTROL_MANAGEMENT_PACK_ACCESS
While to set the parameters we can use the following commands:
ALTER SYSTEM SET STATISTICS_LEVEL = TYPICAL;
ALTER SYSTEM SET CONTROL_MANAGEMENT_PACK_ACCESS = 'DIAGNOSTIC+TUNING';
We are now ready to diagnose a problem using ADDM.
The following steps will demonstrate how to use ADDM:
To run the ADDM in Database mode (all instances of the database will be analyzed), we will use the following statement where the parameters 3 and 5 in these steps are the numbers identifying the beginning and ending snapshots to be used:
VAR task_name VARCHAR2(30);
BEGIN
  :task_name := 'Report for 3 to 5';
  DBMS_ADDM.ANALYZE_DB (:task_name, 3, 5);
END;
To run the ADDM in Instance mode (a single instance of the database will be analyzed), we will use the following statement:
VAR task_name VARCHAR2(30);
BEGIN
  :task_name := 'Report for 3 to 5 inst. 1';
  DBMS_ADDM.ANALYZE_INST (:task_name, 3, 5, 1);
END;
To run the ADDM in Partial mode (a subset of all database instances will be analyzed), we will use the following statement:
VAR task_name VARCHAR2(30);
BEGIN
  :task_name := 'Custom for 3 to 5 inst. 1,2';
  DBMS_ADDM.ANALYZE_INST (:task_name, '1,2', 3, 5);
END;
To view the results we will query the
DBMS_ADDM.GET_REPORTfunction, passing the name of the task used in generating the reports:SELECT DBMS_ADDM.get_report('Report for 3 to 5') FROM DUAL; SELECT DBMS_ADDM.get_report('Report for 3 to 5 inst. 1') FROM DUAL; SELECT DBMS_ADDM.get_report('Custom for 3 to 5 inst. 1,2') FROM DUAL;
Each line in the previous code will display the corresponding ADDM report.
Automatic Database Diagnostic Monitor runs automatically every time a new snapshot is taken by AWR (by default every hour), and the corresponding report is built comparing the last two snapshots available, so we have an ADDM report every hour.
With the statement presented, we can run a report between snapshots to identify possible problems. The reports can be built, for a Real Application Cluster configuration, with three analysis models: database, instance, and partial. In non-RAC databases, only instance analysis is possible because there is only one instance of the database.
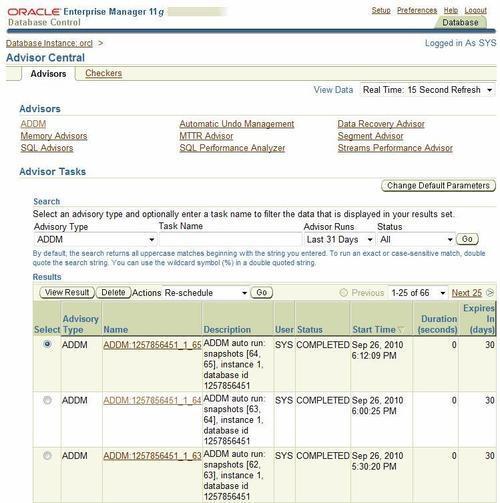
We can see the reports with SQL*Plus using the DBMS_ADDM.GET_REPORT function, which returns a CLOB containing the report (80-columns formatted), or we can use Oracle Enterprise Manager to view the reports generated both in automatic or manual mode. In OEM, we can view ADDM findings in the homepage in the Diagnostic Summary information. We can choose Advisor Central on the bottom of the page to see a list of the ADDM reports available, as shown in the following screenshot:
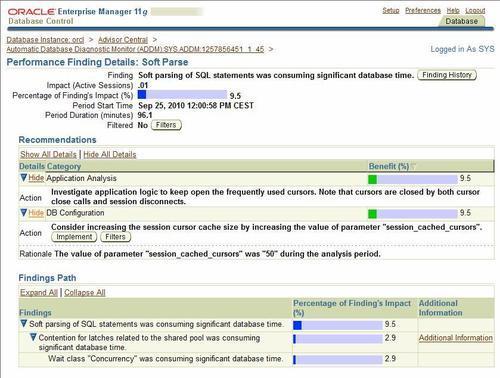
Clicking on the name link in the previous list we can view the corresponding report; in the following screenshot, we can see an example of an ADDM report viewed through OEM:
The parameter DBIO_EXPECTED influences the ADDM analysis of I/O performance, because it describes the expected I/O subsystem performance, measuring the average time needed to read a single database block. The default value of the parameter is 10 milliseconds, corresponding to the average time of common hard disks. Please note that this measure includes the seek time.
If our I/O subsystem is significantly slower or faster, we may end up with possible false alerts or no alerts at all. We can adjust the parameter issuing the following statement:
EXEC DBMS_ADVISOR.SET_DEFAULT_TASK_PARAMETER('ADDM', 'DBIO_EXPECTED', 12000);
The numeric value is the time expressed in microseconds.