Reader small image

You're reading from  Mastering Data Visualization with Microsoft Visio Professional 2016

Product typeBook
Published inMay 2016
PublisherPackt
ISBN-139781785882661
Edition1st Edition
Right arrow
Authors (2):
David Parker
David Parker
author image
David Parker

David J Parker's background has been in data visualization ever since he struggled to produce lists of hospital equipment from Computer Aided Design models of buildings as a budding architect in the '80s. He moved into building and infrastructure asset management in the late '80s using a Unix system and gradually migrated to Windows-based systems throughout the '90s. He became a European Business partner of Visio Corporation in 1996 and presented the database-linked Visio solutions that he was providing merchant banks in London and New York with at several international conferences. David started bVisual Ltd. in 1998, which provides Visio-based solutions to various industries, and became a Silver-level Microsoft partner. He has been a Microsoft MVP (Visio) for the last 12 years and has helped Microsoft Corp, UK and Western Europe, by providing Visio solutions, training, website content, and presentations. David has had several books on Visio published and has been presenting Visio/SharePoint integration courses for many years for Microsoft Western Europe, from Oslo in the North down to Lisbon in the South. He has presented at SQL and SharePoint Saturday conferences and writes a regular blog for people interested in Microsoft Visio.
Read more about David Parker

View More author details
Right arrow

Chapter 4. Using the Built-In Data Graphics

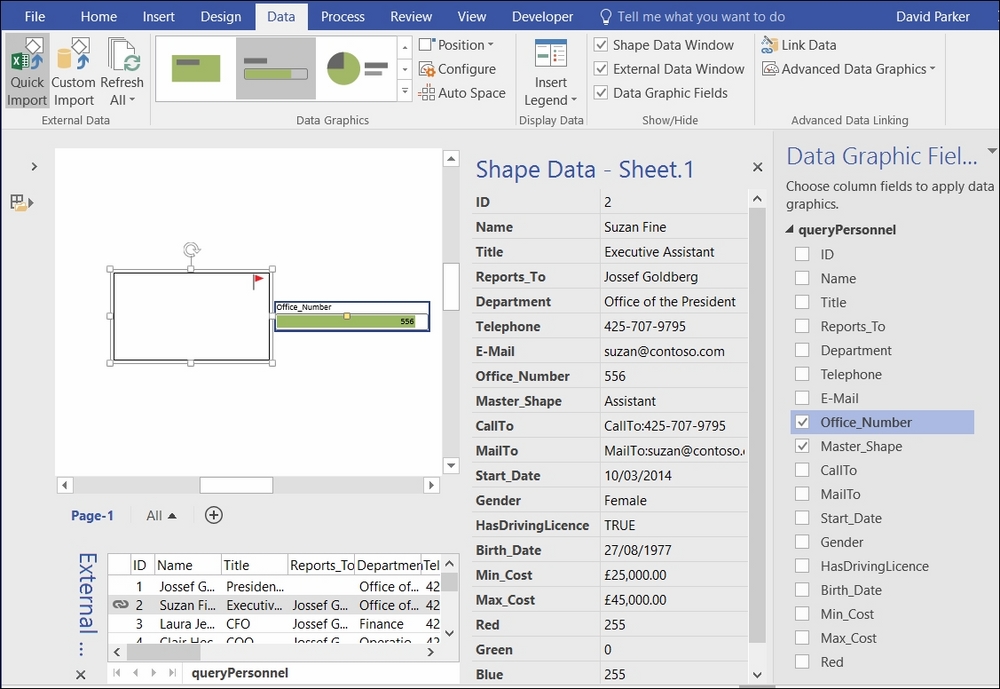
The previous chapter presented the different sources that can be used to import data into Visio Professional documents, and then how rows of data can be linked to shapes. This data surfaced as Data Graphics in many cases without any explanation of this feature. So, this chapter will discuss all the different Data Graphics items that are provided with Visio Professional.

Data Graphics make data diagrams alive with information because they are automatically updated when the data they are linked to changes. They turn a static picture into an information dashboard that can used to present operational intelligence accurately.

In this chapter, we shall cover the following topics:

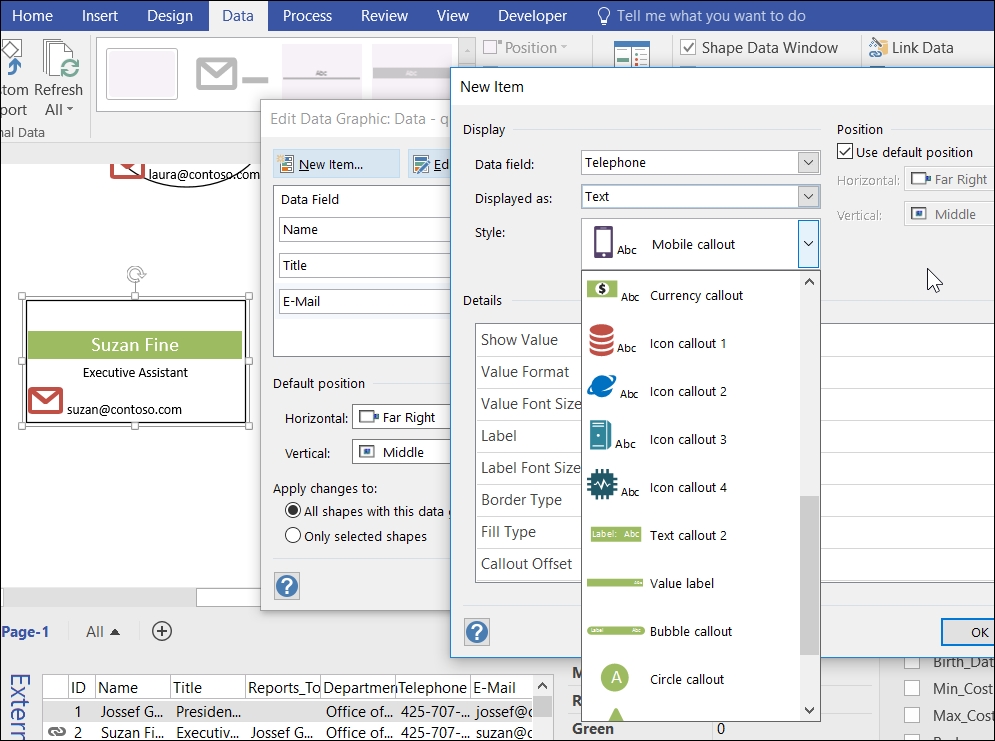
  • Understanding the different Data Graphics types:

    • Text Callout

    • Icon Set

    • Data Bar

    • Color By Value

  • Configuring Data Graphics quickly

  • Using the advanced configuration of Data Graphics

  • Learning how to insert and edit Legends

Displaying data with graphics


The following screenshot from Visio Professional 2016 shows default Data Graphics being applied to a simple rectangle when the row from the External Data window is dragged and dropped on to it:

Visio Professional 2016 added the Data Graphics group to the Data ribbon tab. Apart from the Auto Space button, everything on this ribbon group has been available in all Professional (and Premium) editions since Visio 2007 on the Data Graphics button. This button has now been renamed Advanced Data Graphics, made smaller, and pushed into the Advanced Data Linking group.

The Data Graphic Fields panel, on the far right in the previous screenshot, is also new in Visio 2016. It lists all of the visible DataRecordsets that are in the document, with a checkable list of each visible field/column.

The Data Graphics drop-down gallery, also new in Visio 2016, provides the ability to easily apply a graphic item from one of the four types, as shown in the following screenshot, to the...

Understanding the Graphic Item types


A Data Graphics is a collection of graphic items with specific configurations. The graphic items are each one of four types, Text Callout, Icon Set, Data Bar, or Color By Value. There can be multiple instances of the first three types simultaneously, but there can be only one active Color By Value.

Using Text Callouts

Visio 2016 introduced some new Text Callouts that include an icon along with the text. This has caused a new setting to be added called Show Value, which gives the option to make the text value invisible. There are a number of these new styles available, as seen in the following screenshot:

There are a number of configuration settings available for Text Callouts; they are listed in the following table:

Adding a legend


Once Data Graphics have been applied to the shapes, it can be difficult to remember the meaning of the different colors, icons, and data bars, as shown in this following screenshot:

Fortunately, Visio Professional provides a Data | Display Data | Insert Legend function that will drop a legend, built either horizontally or vertically, in the top-right corner of the page, as shown in the following screenshot:

Once the legend has been dropped onto the page, it can be edited to make the headings and text more readable. In fact, the legend is a special list shape, so through it, each list item could be moved or deleted easily.

Note

Take a look at the following article about the legend with multi-data graphic items: http://blog.bvisual.net/2015/12/24/improving-the-legend-of-multi-data-data-graphic-items-in-visio

Analyzing the composition of a Data Graphic


A Data Graphic is actually stored as a special type of Master in a stencil. The Master contains a reference to each of the graphic items within it along with their configurations. The graphic items are also special masters, except for Color By Value, which is stored as a formula in user-defined cells.

The Data Graphic and Graphic Item masters do not appear in the Document Stencil list, but they are visible in the Drawing Explorer window, as can be seen in the following screenshot:

The following ListDataGraphicMasters() VBA macros simply produces a list of the data graphics in the active Document Stencil:

Listing the graphic item masters is a bit more involved because the necessary information is stored in specific user-defined cells of the group shape. So, the ListGraphicItemMasters() VBA macro, which is displayed in the following screenshot, checks the contents of the User.msvCalloutType cell, if it exists:

A Data Graphic Master is a collection of...

Summary


In this chapter, you learned about the different types and styles of Data Graphics that are available out of the box in Visio Professional 2016. We have seen that most Graphic Items are configurable, and that they are inserted in shapes when Data Graphics are applied.

We have seen how Data Graphics can turn a static diagram into an operational intelligence dashboard.

In the next chapter, you will learn how the Pivot Diagram can be used to form the structure of a visual data diagram.

lock icon
The rest of the chapter is locked
You have been reading a chapter from
Mastering Data Visualization with Microsoft Visio Professional 2016
Published in: May 2016Publisher: PacktISBN-13: 9781785882661
Register for a free Packt account to unlock a world of extra content!
A free Packt account unlocks extra newsletters, articles, discounted offers, and much more. Start advancing your knowledge today.
undefined
Unlock this book and the full library FREE for 7 days
Get unlimited access to 7000+ expert-authored eBooks and videos courses covering every tech area you can think of
Renews at $15.99/month. Cancel anytime

Authors (2)

author image
David Parker

David J Parker's background has been in data visualization ever since he struggled to produce lists of hospital equipment from Computer Aided Design models of buildings as a budding architect in the '80s. He moved into building and infrastructure asset management in the late '80s using a Unix system and gradually migrated to Windows-based systems throughout the '90s. He became a European Business partner of Visio Corporation in 1996 and presented the database-linked Visio solutions that he was providing merchant banks in London and New York with at several international conferences. David started bVisual Ltd. in 1998, which provides Visio-based solutions to various industries, and became a Silver-level Microsoft partner. He has been a Microsoft MVP (Visio) for the last 12 years and has helped Microsoft Corp, UK and Western Europe, by providing Visio solutions, training, website content, and presentations. David has had several books on Visio published and has been presenting Visio/SharePoint integration courses for many years for Microsoft Western Europe, from Oslo in the North down to Lisbon in the South. He has presented at SQL and SharePoint Saturday conferences and writes a regular blog for people interested in Microsoft Visio.
Read more about David Parker

Setting

Comment

Show Value

Select from...