Reader small image

You're reading from  Mastering Data Visualization with Microsoft Visio Professional 2016

Product typeBook
Published inMay 2016
PublisherPackt
ISBN-139781785882661
Edition1st Edition
Right arrow
Authors (2):
David Parker
David Parker
author image
David Parker

David J Parker's background has been in data visualization ever since he struggled to produce lists of hospital equipment from Computer Aided Design models of buildings as a budding architect in the '80s. He moved into building and infrastructure asset management in the late '80s using a Unix system and gradually migrated to Windows-based systems throughout the '90s. He became a European Business partner of Visio Corporation in 1996 and presented the database-linked Visio solutions that he was providing merchant banks in London and New York with at several international conferences. David started bVisual Ltd. in 1998, which provides Visio-based solutions to various industries, and became a Silver-level Microsoft partner. He has been a Microsoft MVP (Visio) for the last 12 years and has helped Microsoft Corp, UK and Western Europe, by providing Visio solutions, training, website content, and presentations. David has had several books on Visio published and has been presenting Visio/SharePoint integration courses for many years for Microsoft Western Europe, from Oslo in the North down to Lisbon in the South. He has presented at SQL and SharePoint Saturday conferences and writes a regular blog for people interested in Microsoft Visio.
Read more about David Parker

View More author details
Right arrow

Chapter 2. Understanding How Data Is Stored within Visio

A Visio user may choose to create a drawing from one of the many Microsoft templates, or even from a custom one. In each case, the user sees that a Visio document can have many pages. Each page can contain many shapes. The Visio user interface normally presents many shapes on stencils that the user can drag and drop onto a page. A user may also use the drawing tools to draw rectangles, ellipses, lines, or just add text. The user may use the ribbon buttons to add containers, callouts or connectors.

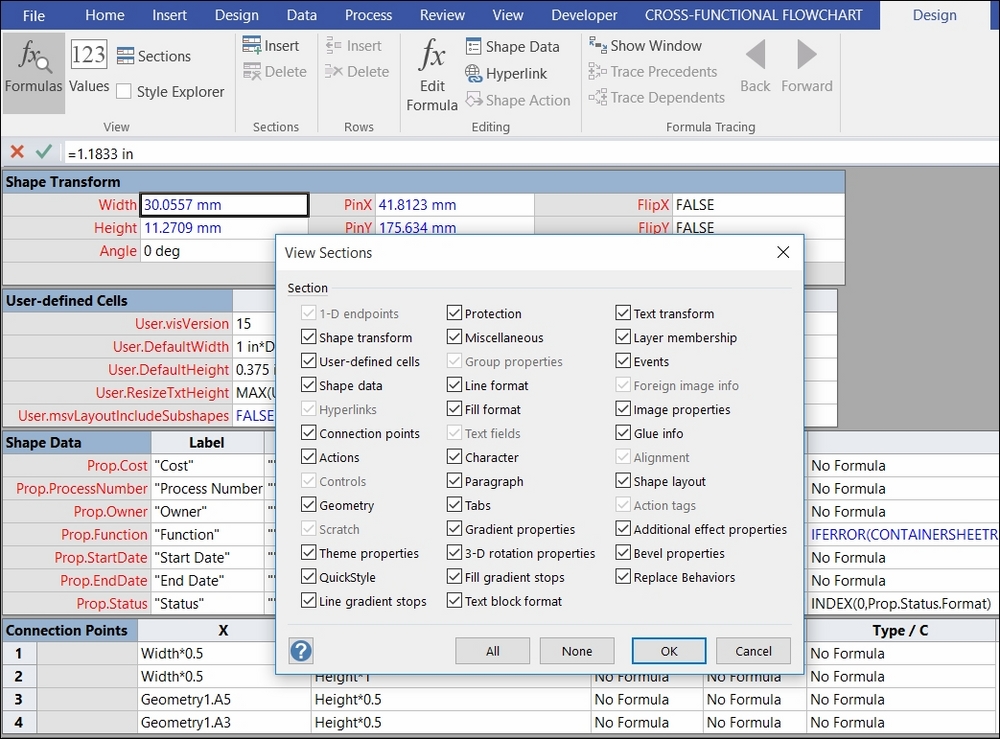
Data can be stored in Visio in many ways, and the developer chooses the way according to the needs of the usage scenario. This chapter will describe the important parts of the rich Visio object model so that a power user who writes macros, or a developer who writes add-ins, will know how to navigate around the various elements. It will also describe the important sections of the programmable ShapeSheet that is behind every shape. Lastly, it...

A very quick introduction to data in Visio


There are many templates and tools within Visio that either import or export data.

The following diagram shows the various data sources or targets listed vertically in the center. The Visio features that can import data are on the left-hand side, and the features that export are on the right. There are many features that use data, but the most relevant features and data sources are enhanced with a thicker outline:

I have omitted SharePoint workflows from this diagram because it is so specialized.

Most of these features utilize the Shape Data capability of Visio shapes, pages, and documents. The following table lists the Visio features that import values into Shape Data rows:

Note

SQL Server stored procedures can also be used as a data source in code in addition to the tables and views that are accessible from the...

Understanding the Visio object model


An object model defines how the various objects and collections relate to each other, and their properties, methods, and events. Knowing how to navigate around it is essential for writing quick code in VBA, or more capable code for an add-in or add-on.

Starting with the Application object

The top-level object is the Visio Application object itself. This object contains a collection of documents that are currently open.

Note

Actually, there is also the InvisibleApp object, which a developer can use to interact with a diagram without the Visio application interface appearing on the screen.

Templates, drawings, and stencils are all types of Visio documents, although the user only sees stencils on the panels of shapes on the left of the drawing page. A drawing is usually created from a template document. However, a drawing can also be created from any existing drawing.

A drawing document consists of a collection of pages, each of which can contain a collection...

Getting to grips with the ShapeSheet


Every document, page, and shape has a ShapeSheet that contains a number of sections, rows, and cells. Cells contain formulas that produce a resultant value.

The document ShapeSheet is known as the DocumentSheet in the object model, but it can be referenced as TheDoc in a cell formula. Similarly, the page ShapeSheet is known as PageSheet in the object model, but it is referred to as ThePage in cell formulas.

There are a lot of mandatory sections in the ShapeSheet, and some of them do not even have their own enumerator in visSectionIndices. Instead, they come under visSectionIndices.visSectionObject. In fact, there are 38 shown on the View Sections dialog, but with only 24 section constants:

It is more efficient to reference a cell by its SRC (Section, Row, Cell) values than by its name. However, there are times when using the name is unavoidable.

If the ShapeSheet is open in the UI, then you can easily find the name of a cell by clicking in the cell, placing...

The Visio file format


Since the 2013 edition, Visio files are Open Packaging Convention compliant, which means that most of the contents are accessible for programmers using some standard techniques. This means that package parts can be more easily extracted, and even modified, without recourse to the Visio type library. Before the 2013 version, Visio files were either binary or monolithic XML files (which were approximately 10 times the size of the binary files). Now that Visio files are zipped-up XML packages, there is greater scope for extensibility. For example, the Visio Web Access control in SharePoint 2010 used XAML to render the graphics on a layer over the top of the Visio binary file. The files had to be published as Visio Web Drawings (*.vdw) to be used, and only the linked Data Graphics content was automatically refreshable. Since the 2013 version, native Visio files are rendered in the Visio Web Access control without needing Silverlight, and any shape cell that is referenced...

Knowing how shapes relate in structured diagrams


The Insert | Diagram Parts tab in the Visio interface provides the ability to add a Container, Callout, or Connector diagram part to a page, as shown in the following screenshot (these are the main parts of a structured diagram):

However, there are also other shapes available from various stencils that exhibit the same behavior. There is also a special type of container called List that can contain ordered items. There are several Microsoft-supplied shapes that are lists, including the UML Class | Class master shape, which is used in the following example. This List shape accepts other specific list item shapes.

This following screenshot contains all of the elements of a structured diagram, namely connections, containers, lists, and callouts:

Everything but the two incoming connections at the top left of the screenshot are selected in order to limit the number of items under consideration in the following paragraphs.

Notice that the container...

Summary


In this chapter, you learned about the rudiments of Visio, and how the ShapeSheet underpins a lot of its power in versatility. We also explored how to use the object model to retrieve information about the structure of the diagrams.

We have seen how much of the data is stored in the Shape Data section, and how other cells in the ShapeSheet can reference these values. To construct automatically refreshable diagrams from data, it is essential that a chain of inter-cell references ultimately end up with linked Shape Data values. So, the next chapter looks into the Link Data feature in Visio Professional.

lock icon
The rest of the chapter is locked
You have been reading a chapter from
Mastering Data Visualization with Microsoft Visio Professional 2016
Published in: May 2016Publisher: PacktISBN-13: 9781785882661
Register for a free Packt account to unlock a world of extra content!
A free Packt account unlocks extra newsletters, articles, discounted offers, and much more. Start advancing your knowledge today.
undefined
Unlock this book and the full library FREE for 7 days
Get unlimited access to 7000+ expert-authored eBooks and videos courses covering every tech area you can think of
Renews at $15.99/month. Cancel anytime

Authors (2)

author image
David Parker

David J Parker's background has been in data visualization ever since he struggled to produce lists of hospital equipment from Computer Aided Design models of buildings as a budding architect in the '80s. He moved into building and infrastructure asset management in the late '80s using a Unix system and gradually migrated to Windows-based systems throughout the '90s. He became a European Business partner of Visio Corporation in 1996 and presented the database-linked Visio solutions that he was providing merchant banks in London and New York with at several international conferences. David started bVisual Ltd. in 1998, which provides Visio-based solutions to various industries, and became a Silver-level Microsoft partner. He has been a Microsoft MVP (Visio) for the last 12 years and has helped Microsoft Corp, UK and Western Europe, by providing Visio solutions, training, website content, and presentations. David has had several books on Visio published and has been presenting Visio/SharePoint integration courses for many years for Microsoft Western Europe, from Oslo in the North down to Lisbon in the South. He has presented at SQL and SharePoint Saturday conferences and writes a regular blog for people interested in Microsoft Visio.
Read more about David Parker