Reader small image

You're reading from  Mastering Data Visualization with Microsoft Visio Professional 2016

Product typeBook
Published inMay 2016
PublisherPackt
ISBN-139781785882661
Edition1st Edition
Right arrow
Authors (2):
David Parker
David Parker
author image
David Parker

David J Parker's background has been in data visualization ever since he struggled to produce lists of hospital equipment from Computer Aided Design models of buildings as a budding architect in the '80s. He moved into building and infrastructure asset management in the late '80s using a Unix system and gradually migrated to Windows-based systems throughout the '90s. He became a European Business partner of Visio Corporation in 1996 and presented the database-linked Visio solutions that he was providing merchant banks in London and New York with at several international conferences. David started bVisual Ltd. in 1998, which provides Visio-based solutions to various industries, and became a Silver-level Microsoft partner. He has been a Microsoft MVP (Visio) for the last 12 years and has helped Microsoft Corp, UK and Western Europe, by providing Visio solutions, training, website content, and presentations. David has had several books on Visio published and has been presenting Visio/SharePoint integration courses for many years for Microsoft Western Europe, from Oslo in the North down to Lisbon in the South. He has presented at SQL and SharePoint Saturday conferences and writes a regular blog for people interested in Microsoft Visio.
Read more about David Parker

View More author details
Right arrow

Chapter 3. Linking Data to Shapes

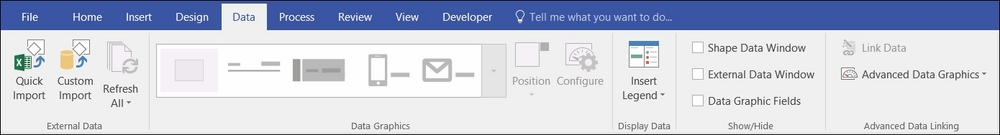
Microsoft introduced the current data-linking feature in the Professional edition of Visio Professional 2007. This feature is better than the database add-on that has been around since Visio 4 because it is has greater importing capabilities and is part of the core product, and it has its own API. This provides the Visio user with a simple method of surfacing data from a variety of data sources, and it gives the power user or developer the ability to create productivity enhancements in code.

Once data is imported into Visio, the rows of data can be linked to shapes and then displayed visually, or they can automatically create hyperlinks. Moreover, if the data is edited outside of Visio, then the data in the Visio shapes can be refreshed so that the shapes reflect the updated data. This can be done in the Visio client, but some data sources can also refresh the data in Visio documents that are displayed in SharePoint web pages.

In this way, Visio documents...

A very quick introduction to importing and linking data


Visio Professional 2016 added more buttons to the Data ribbon tab along with some new Data Graphics, but the functionality has basically been the same since Visio Professional 2007. The new additions, as seen in the following screenshot, can make this particular ribbon tab quite wide on the screen. Thank goodness that wide screens have become the norm!

The process to create data-refreshable shapes in Visio consists of simply carrying out the following steps:

  1. Import data as recordsets.

  2. Link rows of data to shapes.

  3. Make the shapes display the data.

  4. Use any hyperlinks that have been created automatically.

The Quick Import tool introduced in Visio Professional 2016 attempts to merge the first three steps into one, but it rarely gets it perfectly, and it is meant only for simple Excel data sources. Therefore, it is necessary to learn how to use the Custom Import feature properly.

Knowing when to use the Quick Import tool

The Data | External Data...

Summary


This chapter has gone through the many different sources for importing data into Visio and has shown how each can be done manually or with code. This was followed by examples of linking rows of this data to shapes on the drawing page (again, manually and in code).

The next chapter will go into more detail about displaying this data on the shapes using the Data Graphics feature, whether it be simple text, icons, data bars, or color by value.

lock icon
The rest of the chapter is locked
You have been reading a chapter from
Mastering Data Visualization with Microsoft Visio Professional 2016
Published in: May 2016Publisher: PacktISBN-13: 9781785882661
Register for a free Packt account to unlock a world of extra content!
A free Packt account unlocks extra newsletters, articles, discounted offers, and much more. Start advancing your knowledge today.
undefined
Unlock this book and the full library FREE for 7 days
Get unlimited access to 7000+ expert-authored eBooks and videos courses covering every tech area you can think of
Renews at $15.99/month. Cancel anytime

Authors (2)

author image
David Parker

David J Parker's background has been in data visualization ever since he struggled to produce lists of hospital equipment from Computer Aided Design models of buildings as a budding architect in the '80s. He moved into building and infrastructure asset management in the late '80s using a Unix system and gradually migrated to Windows-based systems throughout the '90s. He became a European Business partner of Visio Corporation in 1996 and presented the database-linked Visio solutions that he was providing merchant banks in London and New York with at several international conferences. David started bVisual Ltd. in 1998, which provides Visio-based solutions to various industries, and became a Silver-level Microsoft partner. He has been a Microsoft MVP (Visio) for the last 12 years and has helped Microsoft Corp, UK and Western Europe, by providing Visio solutions, training, website content, and presentations. David has had several books on Visio published and has been presenting Visio/SharePoint integration courses for many years for Microsoft Western Europe, from Oslo in the North down to Lisbon in the South. He has presented at SQL and SharePoint Saturday conferences and writes a regular blog for people interested in Microsoft Visio.
Read more about David Parker