Reader small image

You're reading from  Learning Tableau 2022 - Fifth Edition

Product typeBook
Published inAug 2022
PublisherPackt
ISBN-139781801072328
Edition5th Edition
Tools
Right arrow
Author (1)
Joshua N. Milligan
Joshua N. Milligan
author image
Joshua N. Milligan

Joshua N. Milligan is a Hall of Fame Tableau Zen Master and 2017 Iron Viz Global finalist. His passion is training, mentoring, and helping people gain insights and make decisions based on their data through data visualization using Tableau and data cleaning and structuring using Tableau Prep. He is a principal consultant at Teknion Data Solutions, where he has served clients in numerous industries since 2004.
Read more about Joshua N. Milligan

Right arrow

Waterfall charts

A waterfall chart is useful when you want to show how parts successively build up to a whole. In the following screenshot, for example, a waterfall chart shows how profit builds up to a grand total across Department and Category of products. Sometimes profit is negative, so at that point, the waterfall chart takes a dip, while positive values build up toward the total:
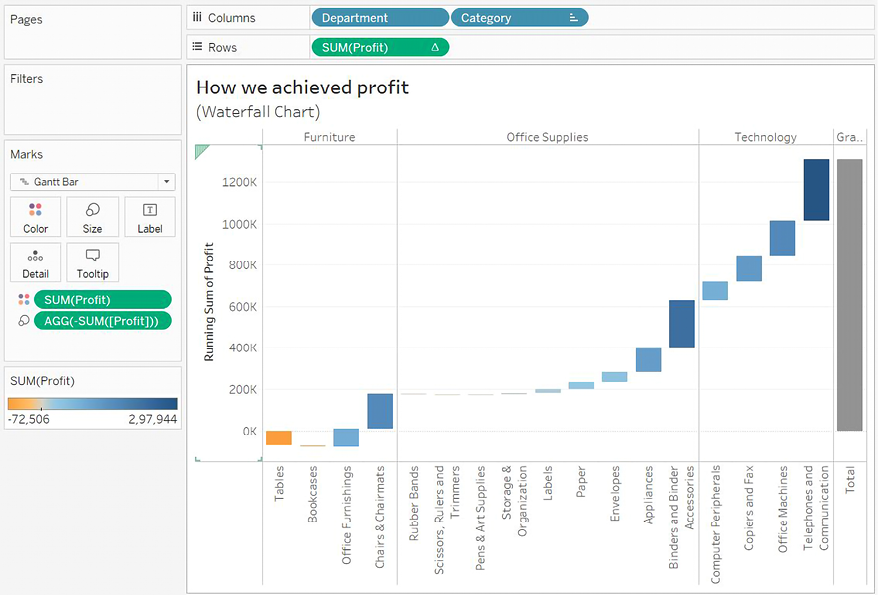
Figure 10.3: This waterfall chart shows how each Category adds (or subtracts) profit to build toward the total

Here are the features and techniques used to build the chart:

  • The SUM(Profit) field on Rows is a Running Total table calculation (created using a Quick Table Calculation from the drop-down menu) and is computed across the table.
  • Row Grand Totals have been added to the view (dragged and dropped from the Analytics pane).
  • The mark type is set to Gantt Bar and an ad hoc calculation is used with code: SUM(Profit) for the size. This may seem a bit odd at first...
lock icon
The rest of the page is locked
Previous PageNext Page
You have been reading a chapter from
Learning Tableau 2022 - Fifth Edition
Published in: Aug 2022Publisher: PacktISBN-13: 9781801072328

Author (1)

author image
Joshua N. Milligan

Joshua N. Milligan is a Hall of Fame Tableau Zen Master and 2017 Iron Viz Global finalist. His passion is training, mentoring, and helping people gain insights and make decisions based on their data through data visualization using Tableau and data cleaning and structuring using Tableau Prep. He is a principal consultant at Teknion Data Solutions, where he has served clients in numerous industries since 2004.
Read more about Joshua N. Milligan