Reader small image

You're reading from  Learning Predictive Analytics with Python

Product typeBook
Published inFeb 2016
Reading LevelIntermediate
Publisher
ISBN-139781783983261
Edition1st Edition
Languages
Right arrow
Authors (2):
Ashish Kumar
Ashish Kumar
author image
Ashish Kumar

Ashish Kumar is a seasoned data science professional, a publisher author and a thought leader in the field of data science and machine learning. An IIT Madras graduate and a Young India Fellow, he has around 7 years of experience in implementing and deploying data science and machine learning solutions for challenging industry problems in both hands-on and leadership roles. Natural Language Procession, IoT Analytics, R Shiny product development, Ensemble ML methods etc. are his core areas of expertise. He is fluent in Python and R and teaches a popular ML course at Simplilearn. When not crunching data, Ashish sneaks off to the next hip beach around and enjoys the company of his Kindle. He also trains and mentors data science aspirants and fledgling start-ups.
Read more about Ashish Kumar

View More author details
Right arrow

Chapter 8. Trees and Random Forests with Python

Clustering, discussed in the last chapter, is an unsupervised algorithm. It is now time to switch back to a supervised algorithm. Classification is a class of problems that surfaces quite frequently in predictive modelling and in various forms. Accordingly, to deal with all of them, a family of classification algorithms is used.

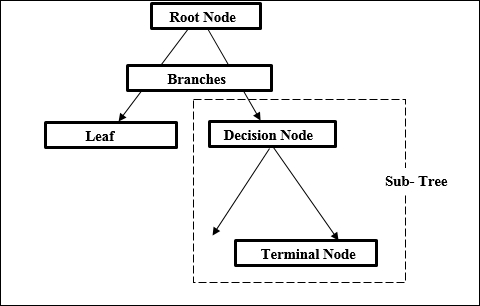
A decision tree is a supervised classification algorithm that is used when the target variable is a discrete or categorical variable (having two or more than two classes) and the predictor variables are either categorical or numerical variables. A decision tree can be thought of as a set of if-then rules for a classification problem where the target variables are discrete or categorical variables. The if-then rules are represented as a tree.

A decision tree is used when the decision is based on multiple-staged criteria and variables. A decision tree is very effective as a decision making tool as it has a pictorial output...

Introducing decision trees


A tree is a data structure that might be used to state certain decision rules because it can be represented in such a way as to pictorially illustrate these rules. A tree has three basic elements: nodes, branches, and leaves. Nodes are the points from where one or more branches come out. A node from where no branch originates is a leaf. A typical tree looks as follows:

Fig. 8.1: A representation of a decision tree with its basic elements—node, branches, and leaves

A tree, specifically a decision tree, starts with a root node, proceeds to the decision nodes, and ultimately to the terminal nodes where the decision rules are made. All nodes, except the terminal node, represent one variable and the branches represent the different categories (values) of that variable. The terminal node represents the final decision or value for that route.

A decision tree

To understand what decision trees look like and how to make sense of them, let us consider an example. Consider a situation...

Understanding the mathematics behind decision trees


The main goal in a decision tree algorithm is to identify a variable and classification on which one can give a more homogeneous distribution with reference to the target variable. The homogeneous distribution means that similar values of the target variable are grouped together so that a concrete decision can be made.

Homogeneity

In the preceding example, the first goal would be to find a parameter (out of four: Terrain, Rainfall, Groundwater, and Fertilizers) that results in a better homogeneous distribution of the target variable within those categories.

Without any parameter, the count of harvest type looks as follows:

Bumper

Moderate

Meagre

4

9

7

Let us calculate, for each parameter, how the split on that parameter affects the homogeneity of the target variable split:

Fig. 8.4: Splitting the predictor and the target variables into categories to see their effect on the homogeneity of the dataset

If one...

Implementing a decision tree with scikit-learn


Now, when we are sufficiently aware of the mathematics behind decision trees, let us implement a simple decision tree using the methods in scikit-learn. The dataset we will be using for this is a commonly available dataset called the iris dataset that has information about flower species and their petal and sepal dimensions. The purpose of this exercise will be to create a classifier that can classify a flower as belonging to a certain species based on the flower petal and sepal dimensions.

To do this, let's first import the dataset and have a look at it:

import pandas as pd
data=pd.read_csv('E:/Personal/Learning/Predictive Modeling Book/My Work/Chapter 7/iris.csv')
data.head()

The datasheet looks as follows:

Fig. 8.7: The first few observations of the iris dataset

Sepal-length, Sepal-width, Petal-length, and Petal-width are the dimensions of the flower while the Species denotes the class the flower belongs to. There are actually three classes of...

Understanding and implementing regression trees


An algorithm very similar to decision trees is regression tree. The difference between the two is that the target variable in the case of a regression tree is a continuous numerical variable, unlike decision trees where the target variable is a categorical variable.

Regression tree algorithm

Regression trees are particularly useful when there are multiple features in the training dataset that interact in complicated and non-linear ways. In such cases, a simple linear regression or even the linear regression with some tweaks will not be feasible or produces a very complex model that will be of little use. An alternative to non-linear regression is to partition the dataset into smaller nodes/local partitions where the interactions are more manageable. We keep partitioning until the point where the non-linear interactions are non-existent or the observations in that partition/node are very similar to each other. This is called recursive partition...

Understanding and implementing random forests


Random forests is a predictive algorithm falling under the ambit of ensemble learning algorithms. Ensemble learning algorithms consist of a combination of various independent models (similar or different) to solve a particular prediction problem. The final result is calculated based on the results from all these independent models, which is better than the results of any of the independent models.

There are two kinds of ensemble algorithm, as follows:

  • Averaging methods: Several similar independent models are created (in the case of decision trees, it can mean trees with different depths or trees involving a certain variable and not involving the others, and so on.) and the final prediction is given by the average of the predictions of all the models.

  • Boosting methods: The goal here is to reduce the bias of the combined estimator by sequentially building it from the base estimators. A powerful model is created using several weak models.

Random forest...

Summary


In this chapter on the decision trees, we first tried to understand the structure and the meaning of a decision tree. This was followed by a discussion on the mathematics behind creating a decision tree. Apart from implementing a decision tree in Python, the chapter also discussed the mathematics of related algorithms such as regression trees and random forests. Here is a brief summary of the chapter:

  • A decision tree is a classification algorithm used when the predictor variables are either categorical or continuous numerical variables.

  • Splitting a node into subnodes so that one gets a more homogeneous distribution (similar observations together), is the primary goal while making a tree.

  • There are various methods to decide which variable should be used to split the node. These methods include information gain, Gini, and maximum reduction in variance methods.

  • The method of building a regression tree is very similar to a decision tree. However, the target variable in the case of a regression...

lock icon
The rest of the chapter is locked
You have been reading a chapter from
Learning Predictive Analytics with Python
Published in: Feb 2016Publisher: ISBN-13: 9781783983261
Register for a free Packt account to unlock a world of extra content!
A free Packt account unlocks extra newsletters, articles, discounted offers, and much more. Start advancing your knowledge today.
undefined
Unlock this book and the full library FREE for 7 days
Get unlimited access to 7000+ expert-authored eBooks and videos courses covering every tech area you can think of
Renews at $15.99/month. Cancel anytime

Authors (2)

author image
Ashish Kumar

Ashish Kumar is a seasoned data science professional, a publisher author and a thought leader in the field of data science and machine learning. An IIT Madras graduate and a Young India Fellow, he has around 7 years of experience in implementing and deploying data science and machine learning solutions for challenging industry problems in both hands-on and leadership roles. Natural Language Procession, IoT Analytics, R Shiny product development, Ensemble ML methods etc. are his core areas of expertise. He is fluent in Python and R and teaches a popular ML course at Simplilearn. When not crunching data, Ashish sneaks off to the next hip beach around and enjoys the company of his Kindle. He also trains and mentors data science aspirants and fledgling start-ups.
Read more about Ashish Kumar