Reader small image

You're reading from  Learning Predictive Analytics with Python

Product typeBook
Published inFeb 2016
Reading LevelIntermediate
Publisher
ISBN-139781783983261
Edition1st Edition
Languages
Right arrow
Authors (2):
Ashish Kumar
Ashish Kumar
author image
Ashish Kumar

Ashish Kumar is a seasoned data science professional, a publisher author and a thought leader in the field of data science and machine learning. An IIT Madras graduate and a Young India Fellow, he has around 7 years of experience in implementing and deploying data science and machine learning solutions for challenging industry problems in both hands-on and leadership roles. Natural Language Procession, IoT Analytics, R Shiny product development, Ensemble ML methods etc. are his core areas of expertise. He is fluent in Python and R and teaches a popular ML course at Simplilearn. When not crunching data, Ashish sneaks off to the next hip beach around and enjoys the company of his Kindle. He also trains and mentors data science aspirants and fledgling start-ups.
Read more about Ashish Kumar

View More author details
Right arrow

Chapter 6. Logistic Regression with Python

In the previous chapter, we learned about linear regression. We saw that linear regression is one of the most basic models that assumes that there is a linear relationship between a predictor variable and an output variable.

In this chapter, we will be discussing the details of logistic regression. We will be covering the following topics in this chapter:

  • Math behind logistic regression: Logistic regression relies on concepts such as conditional probability and odds ratio. In this chapter, we will understand what they mean and how they are applied. We will also see how the odds ratio is transformed to establish a linear relationship with the predictor variable. We will analyze the final logistic regression equation and understand the meaning of each term and coefficient.

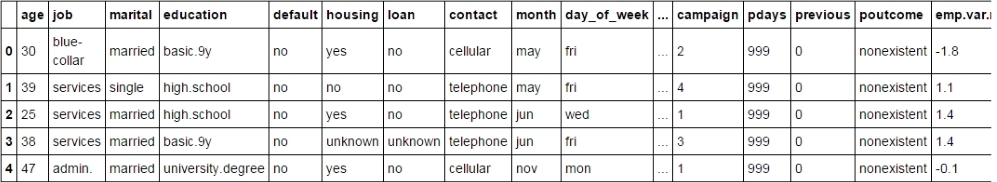
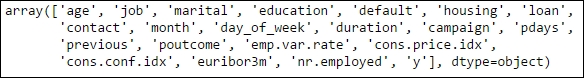
  • Implementing logistic regression with Python: Similar to what we did in the last chapter, we will take a dataset and implement a logistic regression model on it to understand the...

Linear regression versus logistic regression


One thing to note about the linear regression model is that the output variable is always a continuous variable. In other words, linear regression is a good choice when one needs to predict continuous numbers. However, what if the output variable is a discrete number. What if we want to classify our records in two or more categories? Can we still extend the assumptions of a linear relationship and try to classify the records?

As it happens, there is a separate regression model that takes care of a situation where the output variable is a binary or categorical variable rather than a continuous variable. This model is called logistic regression. In other words, logistic regression is a variation of linear regression where the output variable is a binary or categorical variable. The two regressions are similar in the sense that they both assume a linear relationship between the predictor and output variables. However, as we will see soon, the output...

Understanding the math behind logistic regression


Imagine a situation where we have a dataset from a supermarket store about the gender of the customer and whether that person bought a particular product or not. We are interested in finding the chances of a customer buying that particular product, given their gender. What comes to mind when someone poses this question to you? Probability anyone? Odds of success?

What is the probability of a customer buying a product, given he is a male? What is the probability of a customer buying that product, given she is a female? If we know the answers to these questions, we can make a leap towards predicting the chances of a customer buying a product, given their gender.

Let us look at such a dataset. To do so, we write the following code snippet:

import pandas as pd
df=pd.read_csv('E:/Personal/Learning/Predictive Modeling Book/Book Datasets/Logistic Regression/Gender Purchase.csv')
df.head()

Fig. 6.1: Gender and Purchase dataset

The first column mentions...

Implementing logistic regression with Python


We have understood the mathematics that goes behind the logistic regression algorithm. Now, let's take one dataset and implement a logistic regression model from scratch. The dataset we will be working with is from the marketing department of a bank and has data about whether the customers subscribed to a term deposit, given some information about the customer and how the bank has engaged and reached out to the customers to sell the term deposit.

Let us import the dataset and start exploring it:

import pandas as pd
bank=pd.read_csv('E:/Personal/Learning/Predictive Modeling Book/Book Datasets/Logistic Regression/bank.csv',sep=';')
bank.head()

The dataset looks as follows:

Fig. 6.6: A glimpse of the bank dataset

There are 4119 records and 21 columns. The column names are as follows:

bank.columns.values

Fig. 6.7: The columns of the bank dataset

The details of each column are mentioned in the Data Dictionary file present in the Logistic Regression folder...

Model validation and evaluation


The preceding logistic regression model is built on the entire data. Let us now split the data into training and testing sets, build the model using the training set, and then check the accuracy using the testing set. The ultimate goal is to see whether it improves the accuracy of the prediction or not:

from sklearn.cross_validation import train_test_split
X_train, X_test, Y_train, Y_test = train_test_split(X, Y, test_size=0.3, random_state=0)

The preceding code snippet creates testing and training datasets for a predictor and also outcome variables. Let us now build a logistic regression model over the training set:

from sklearn import linear_model
from sklearn import metrics
clf1 = linear_model.LogisticRegression()
clf1.fit(X_train, Y_train)

The preceding code snippet creates the model. If you remember the equation behind the model, you will know that the model predicts probabilities and not the classes (binary output, that is, 0 or 1). One needs to select a...

Model validation


Once the model has been built and evaluated, the next step is to validate the model. In the case of logistic regression models or classification models in general, we basically validate the model by comparing the actual class with the predicted class. There are various ways to do this, but the most famous and widely used is the Receiver Operating Characteristic (ROC) curve.

The ROC curve

An ROC curve is a graphical tool to understand the performance of a classification model. For a logistic regression model, a prediction can either be positive or negative. Also, this prediction can either be correct or incorrect.

There are four categories in which the predictions of a logistic regression model can fall:

Summary


A logistic regression is a versatile technique used widely in the cases where the variable to be predicted is a binary (or categorical) variable. This chapter dives deep into the math behind the logistics regression and the process to implement it using the scikit-learn and statsmodel api modules. It is important to understand the math behind the algorithm so that the model is not used as a black box without knowing what is going on behind the hood. To recap, the following are the main takeaways from the chapter:

  • Linear regression wouldn't be an appropriate model to predict binary variables as the predictor variables can range from -infinity to +infinity, while the binary variable would be 0 or 1.

  • The odds of a certain event happening is the probability of that event happening divided by the probability of that event not happening. The higher the odds, the higher are the chances of the event happening. The odds can range from 0 to infinity.

  • The final equation for the logistic regression...

lock icon
The rest of the chapter is locked
You have been reading a chapter from
Learning Predictive Analytics with Python
Published in: Feb 2016Publisher: ISBN-13: 9781783983261
Register for a free Packt account to unlock a world of extra content!
A free Packt account unlocks extra newsletters, articles, discounted offers, and much more. Start advancing your knowledge today.
undefined
Unlock this book and the full library FREE for 7 days
Get unlimited access to 7000+ expert-authored eBooks and videos courses covering every tech area you can think of
Renews at $15.99/month. Cancel anytime

Authors (2)

author image
Ashish Kumar

Ashish Kumar is a seasoned data science professional, a publisher author and a thought leader in the field of data science and machine learning. An IIT Madras graduate and a Young India Fellow, he has around 7 years of experience in implementing and deploying data science and machine learning solutions for challenging industry problems in both hands-on and leadership roles. Natural Language Procession, IoT Analytics, R Shiny product development, Ensemble ML methods etc. are his core areas of expertise. He is fluent in Python and R and teaches a popular ML course at Simplilearn. When not crunching data, Ashish sneaks off to the next hip beach around and enjoys the company of his Kindle. He also trains and mentors data science aspirants and fledgling start-ups.
Read more about Ashish Kumar

Actual/predicted

Positive

Negative

Positive

True Positive (TP):

  • Correct positive prediction

  • Actually positive and prediction is also positive

True Negative (TN):

  • Correct negative prediction

  • Actually negative and prediction is also...