

Why graphs?
The first question we need to address is: why are we interested in graphs in the first place? Graph theory, the mathematical study of graphs, has emerged as a fundamental tool for understanding complex systems and relationships. A graph is a visual representation of a collection of nodes (also called vertices) and edges that connect these nodes, providing a structure to represent entities and their relationships (see Figure 1.1).
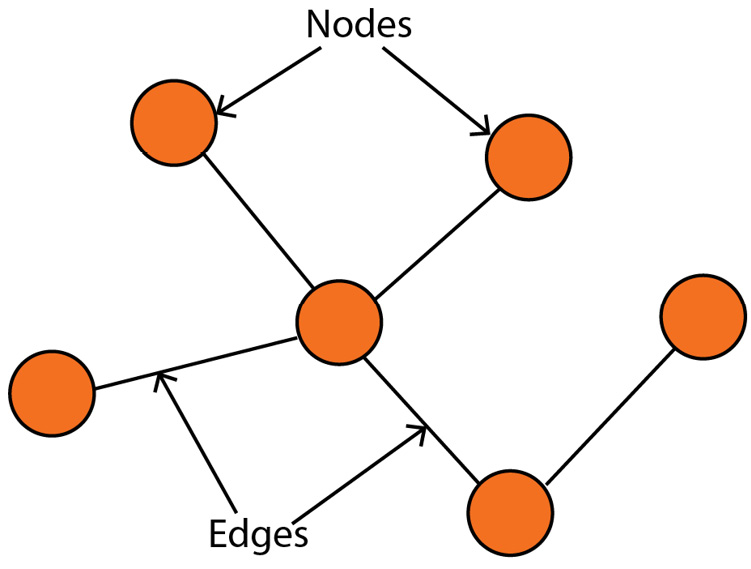
Figure 1.1 – Example of a graph with six nodes and five edges
By representing a complex system as a network of entities with interactions, we can analyze their relationships, allowing us to gain a deeper understanding of their underlying structures and patterns. The versatility of graphs makes them a popular choice in various domains, including the following:
- Computer science, where graphs can be used to model the structure of computer programs, making it easier to understand how different components of a system interact with each other
- Physics, where graphs can be used to model physical systems and their interactions, such as the relationship between particles and their properties
- Biology, where graphs can be used to model biological systems, such as metabolic pathways, as a network of interconnected entities
- Social sciences, where graphs can be used to study and understand complex social networks, including the relationships between individuals in a community
- Finance, where graphs can be used to analyze stock market trends and relationships between different financial instruments
- Engineering, where graphs can be used to model and analyze complex systems, such as transportation networks and electrical power grids
These domains naturally exhibit a relational structure. For instance, graphs are a natural representation of social networks: nodes are users, and edges represent friendships. But graphs are so versatile they can also be applied to domains where the relational structure is less natural, unlocking new insights and understanding.
For example, images can be represented as a graph, as in Figure 1.2. Each pixel is a node, and edges represent relationships between neighboring pixels. This allows for the application of graph-based algorithms to image processing and computer vision tasks.
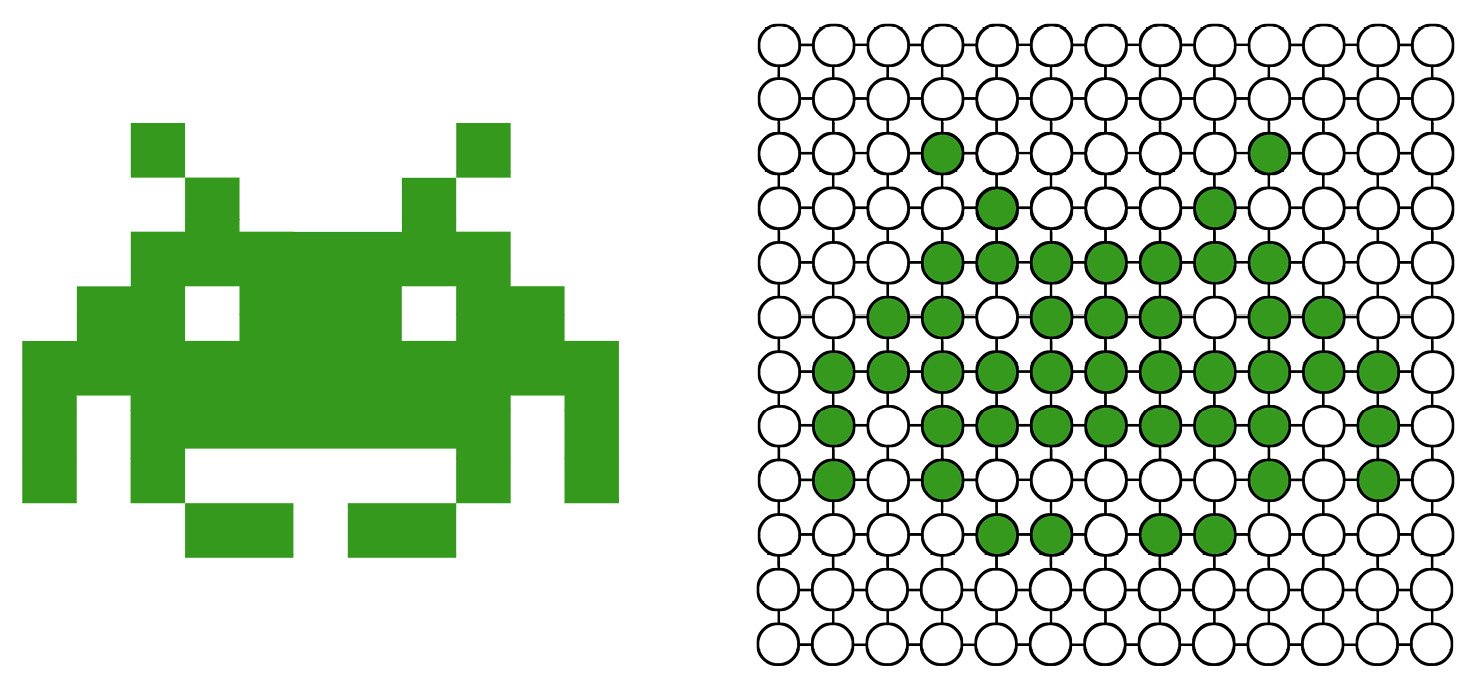
Figure 1.2 – Left: original image; right: graph representation of this image
Similarly, a sentence can be transformed into a graph, where nodes are words and edges represent relationships between adjacent words. This approach is useful in natural language processing and information retrieval tasks, where the context and meaning of words are critical factors.
Unlike text and images, graphs do not have a fixed structure. However, this flexibility also makes graphs more challenging to handle. The absence of a fixed structure means they can have an arbitrary number of nodes and edges, with no specific ordering. In addition, graphs can represent dynamic data, where the connections between entities can change over time. For example, the relationships between users and products can change as they interact with each other. In this scenario, nodes and edges are updated to reflect changes in the real world, such as new users, new products, and new relationships.
In the next section, we will delve deeper into how to use graphs with machine learning to create valuable applications.