Search icon
Arrow left icon
All Products
Best Sellers
New Releases
Books
Videos
Audiobooks
Learning Hub
Newsletters
Free Learning
Arrow right icon
Hands-On Financial Modeling with Excel for Microsoft 365 - Second Edition

You're reading from  Hands-On Financial Modeling with Excel for Microsoft 365 - Second Edition

Product type Book
Published in Jun 2022
Publisher Packt
ISBN-13 9781803231143
Pages 346 pages
Edition 2nd Edition
Languages
Author (1):
Shmuel Oluwa Shmuel Oluwa
Profile icon Shmuel Oluwa

Table of Contents (19) Chapters

Preface Part 1 – Financial Modeling Overview
Chapter 1: An Introduction to Financial Modeling and Excel Chapter 2: Steps for Building a Financial Model Part 2 – The Use of Excel Features and Functions for Financial Modeling
Chapter 3: Formulas and Functions – Completing Modeling Tasks with a Single Formula Chapter 4: Referencing Framework in Excel Chapter 5: An Introduction to Power Query Part 3 – Building an Integrated 3-Statement Financial Model with Valuation by DCF
Chapter 6: Understanding Project and Building Assumptions Chapter 7: Asset and Debt Schedules Chapter 8: Preparing a Cash Flow Statement Chapter 9: Ratio Analysis Chapter 10: Valuation Chapter 11: Model Testing for Reasonableness and Accuracy Part 4 – Case Study
Chapter 12: Case Study 1 – Building a Model to Extract a Balance Sheet and Profit and Loss from a Trial Balance Chapter 13: Case Study 2 – Creating a Model for Capital Budgeting Other Books You May Enjoy

Illustrative example

Some of the many errors found in source data include partial summarization of the data and grouping of some field headers. In this example, we are going to clean and transform data using various tools, including Unpivot.

You are given a dataset of sales per salesperson in two regions. The dataset includes a number of anomalies, including subtotals and headers in more than one row, as shown in Figure 5.11. You are asked to prepare a pivot table from the data.

(Sample data is available for download to give a more hands-on experience.)

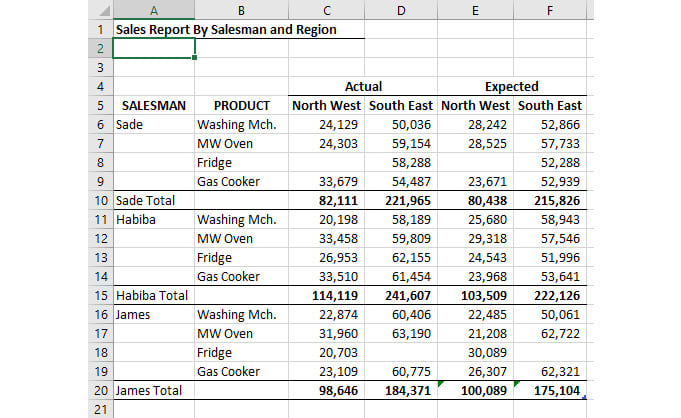
Figure 5.11 – Sales by salesperson, by product, and by region

Use the following steps to load the table into Power Query, transform the data, and finally load it back into Excel as clean data ready for further analysis:

  1. The first step is to convert the data into a table.

Since the data has multiple header rows (see Figure 5.12), you will have to uncheck the option that says My...

lock icon The rest of the chapter is locked
Register for a free Packt account to unlock a world of extra content!
A free Packt account unlocks extra newsletters, articles, discounted offers, and much more. Start advancing your knowledge today.
Unlock this book and the full library FREE for 7 days
Get unlimited access to 7000+ expert-authored eBooks and videos courses covering every tech area you can think of
Renews at $15.99/month. Cancel anytime}