


How do I install Power Pivot?
To install or enable Power Pivot in Excel, please go through the following steps:
- Open a new Excel workbook and go to the Data tab:
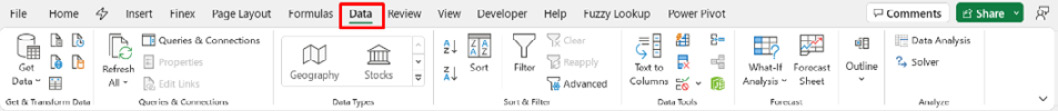
Figure 1.10 – Enabling the Data tab in Microsoft Excel
- In the Data Tools group, go to the Power Pivot window:
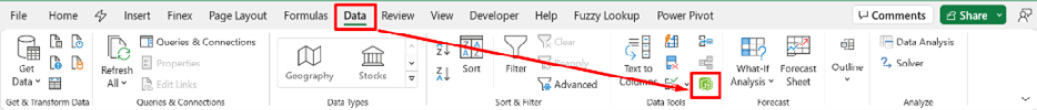
Figure 1.11 – Enabling the Power Pivot tab in Microsoft Excel
- If this is the first time you are using Power Pivot, you will see the following pop-up message:
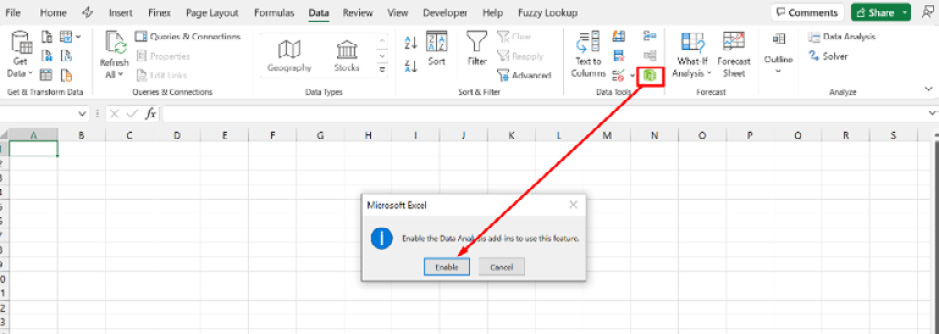
Figure 1.12 – Pop-up message while enabling Power Pivot
- Click on Enable. After a few seconds, the Power Pivot window will open to confirm that the installation was successful.
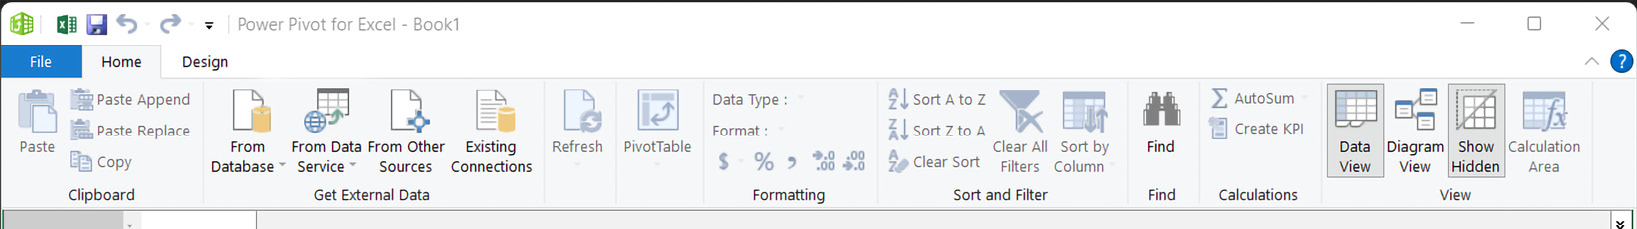
Figure 1.13 – Enabling the Power Pivot Tab in Microsoft Excel
- You will find a new Power Pivot Command tab on your ribbon when the process is completed.
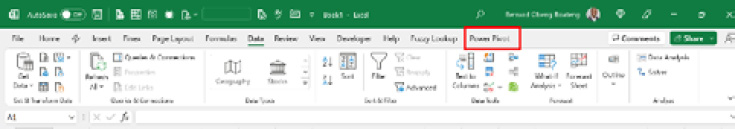
Figure 1.14 – Process is complete
You should find the Tab present anytime you open a new workbook.
There are situations where the Power Pivot tab is not available when you open a new workbook. This could be because of low disk space or memory issues with the computer. A quick way to resolve this will be to restart your computer or create some disk space and follow the following steps:
- Go to File | Options | Add-ins, select COM Add-ins, and click on Go.
This will display the following screen:
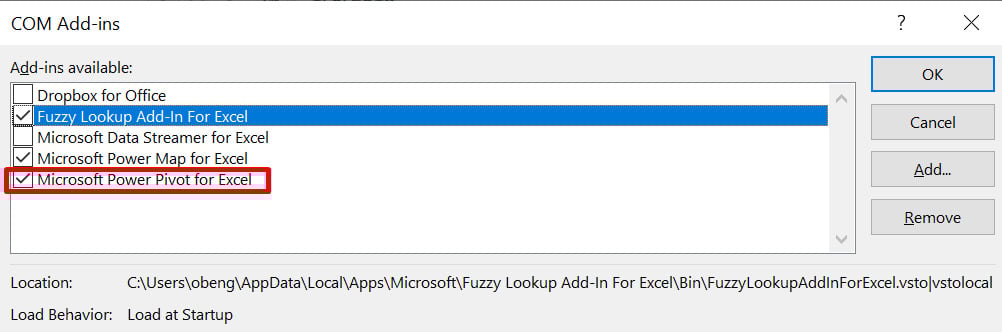
Figure 1.15 – Resetting the Power Pivot tab in Microsoft Excel
- Unchecking and checking the box will reset the tab and you should find it available in the Command tabs area again.
We have now installed Power Pivot. In the next section, we will take a tour to understand how we can take full advantage of some of the features of the tool for our data modeling.
Exploring the features of Power Pivot
In this section, we are going to explore some of the key features of Power Pivot. It’s important you begin learning about these features to help you use and apply them when we start working with data.
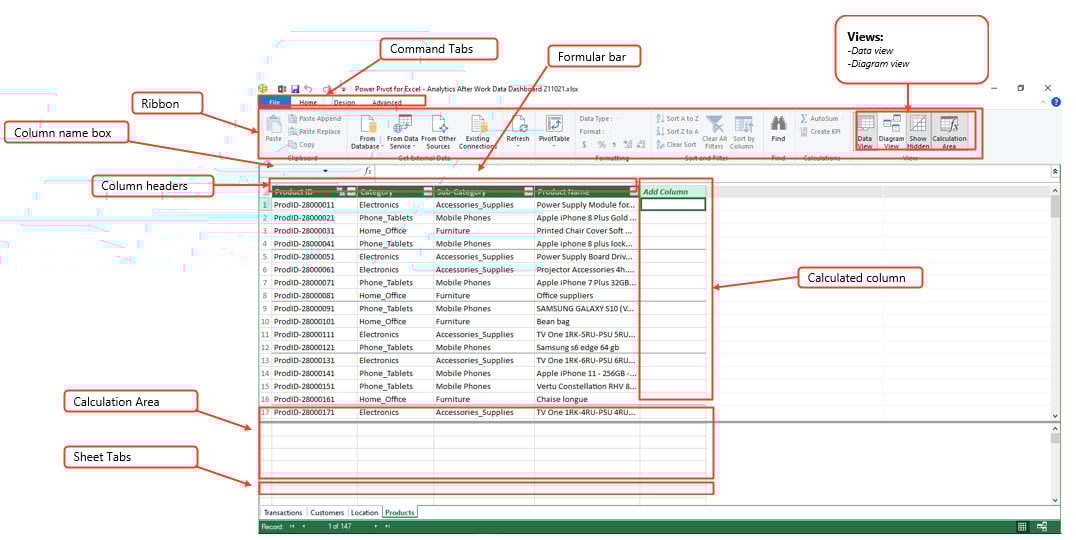
Figure 1.16 – Components of Excel’s Power Pivot
Some of the useful features of Power Pivot are described here:
- Command tabs: Here, you will find the Home and Design tabs. The Home tab contains a group of icons for the following:
- Formatting
- Calculations
- Sorting and filtering
- Views (data and diagram view)
- Connecting to data sources (get external data)
- The Design tab contains icons for managing the following:
- Columns
- Calculations
- Relationships
- Creating calendars
- Formula bar: This displays the formulas for your calculated column and measures when you select them. You can also use the field to create formulas from scratch.
- Views: The View group under the Home tab is useful for switching between a tabular view of your datasets or a diagram view. You can also use this menu to turn off some aspects of Power Pivot.
- Calculated Column: This area helps you to calculate and add new columns to your original datasets.
- Calculation Area: You can create your measures and store them in this section of Power Pivot. You can turn this section off using the option in the View group.
- The view in Power Pivot is similar to the worksheet view in Microsoft Excel. However, in Power Pivot, you can’t edit cells or create calculations by referencing cells. Calculations are done using the columnar view in the data using a formula language called DAX.
What is DAX?
Think of DAX as a more powerful version of the regular Excel formulas you might already know, such as SUM or AVERAGE. DAX allows you to do more complex things with your data, such as summing up sales for a specific time period or calculating year-over-year growth, all while working within your data model.
So, if you’re using a data model in Excel to help make sense of your business data, DAX is the tool that helps you ask specific questions and get precise answers from that model. It’s like having a super-smart calculator that can quickly crunch the numbers in different ways, helping you make better business decisions. We will go into this in detail in subsequent chapters. These calculations can result in a new dimensional column or a new measure.
Beyond understanding the features of Power Pivot, it is important to adopt some best practices when working with this tool. In the next section, we will cover some of these best practices.