
Preparing Your Data for the Data Model – Cleaning and Transforming Your Data Using Power Query
Having understood the best practices for data structuring in our earlier chapters, we will take a look at how to prepare our data for data modeling using Power Query—Microsoft Excel’s data cleaning and transformation tool.
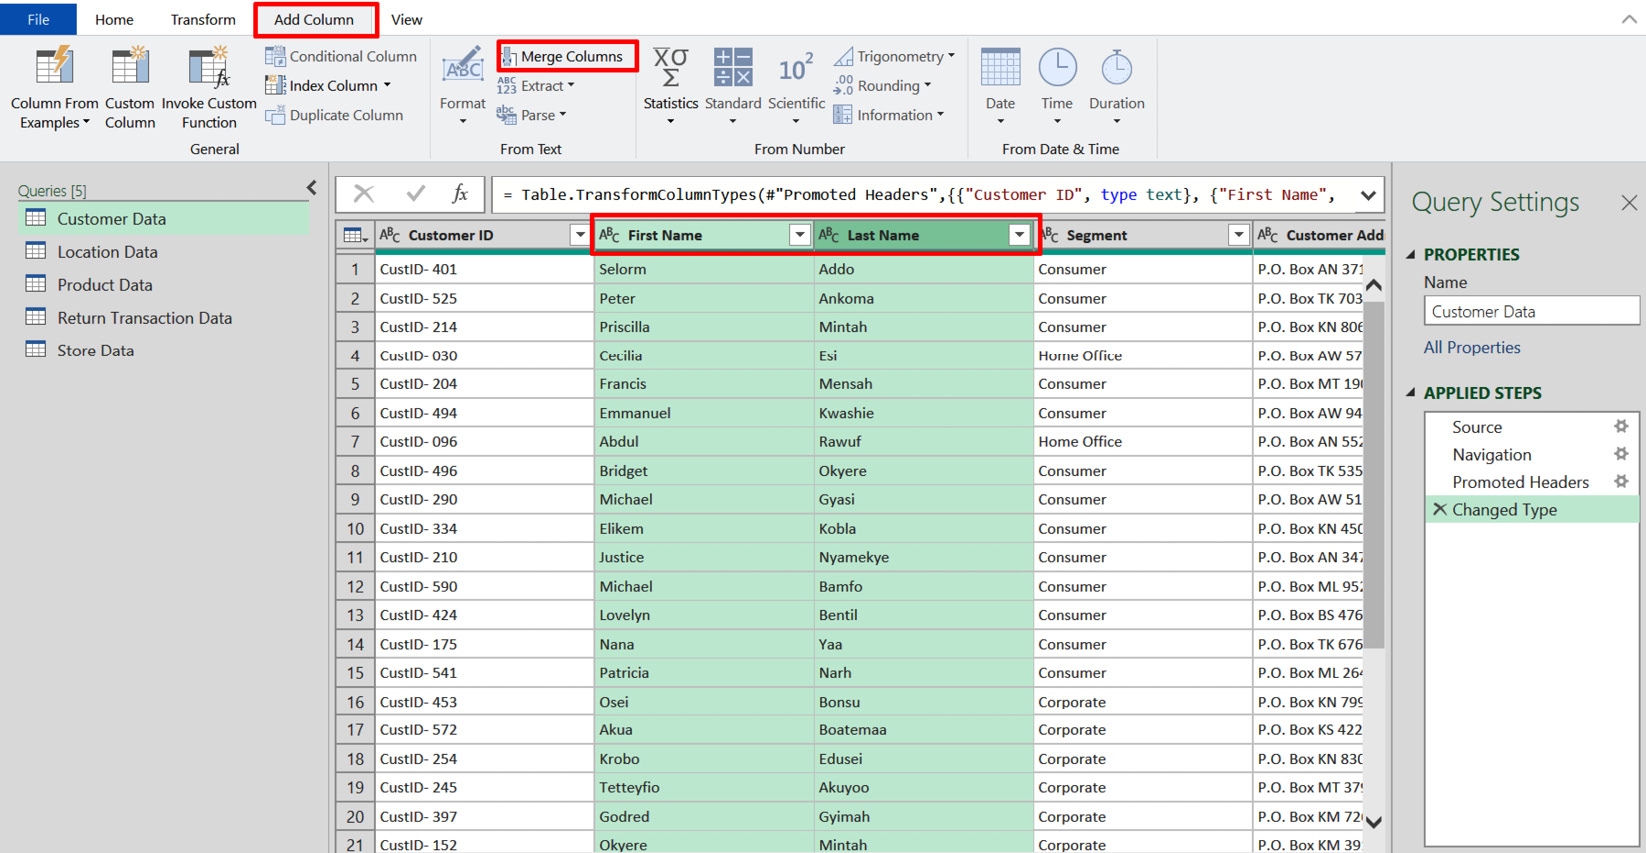
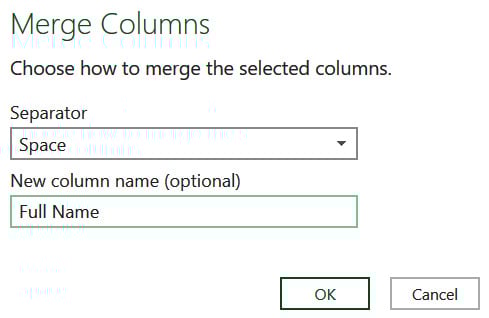
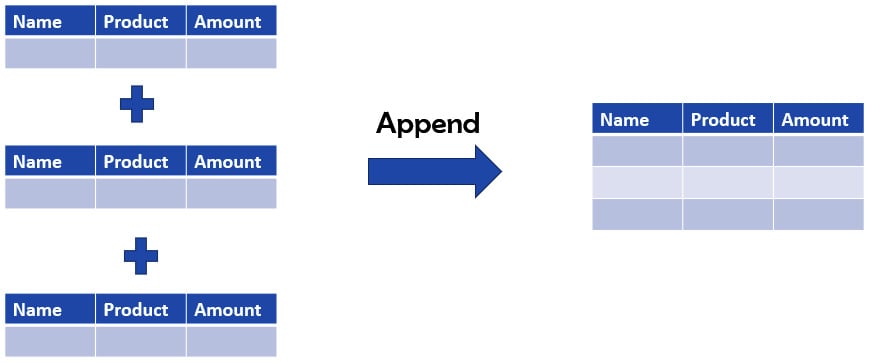
In this chapter, you will understand the architecture of the Power Query editor and data types and how to use the Transform and Add Column tabs to correct any issues with the sample sales data. You will also learn how to append and merge data from our sample sales data.
The following topics will be covered in this chapter:
- Understanding queries and connections
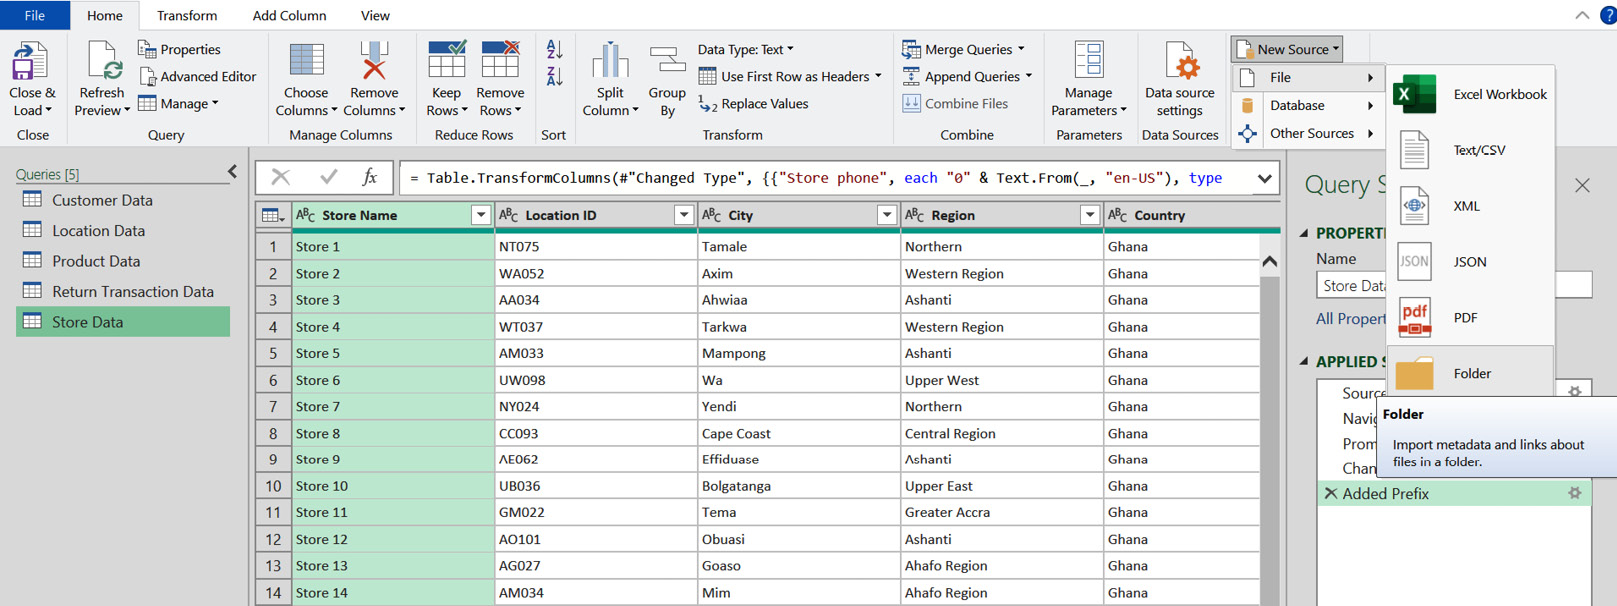
- An overview of the Power Query editor
- Getting your data type right
- Add Column or Transform?
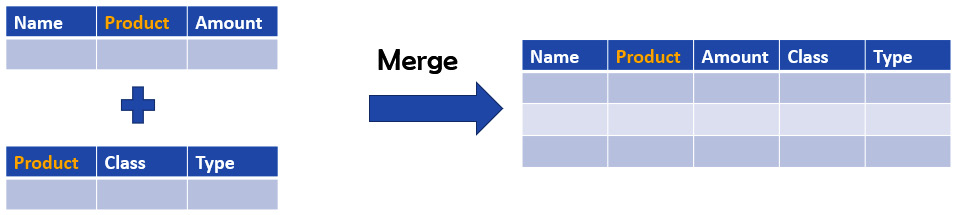
- Merging and appending data using Power Query