Reader small image

You're reading from  Data Modeling with Microsoft Excel

Product typeBook
Published inNov 2023
PublisherPackt
ISBN-139781803240282
Edition1st Edition
Right arrow
Author (1)
Bernard Obeng Boateng
author image
Bernard Obeng Boateng

Bernard Obeng Boateng is a Microsoft Excel MVP, Microsoft Certified Trainer, with over 10 years work experience in Banking, Insurance and Business Development. He is founder of Finex Skills Hub an approved Training Provider of the Financial Modeling Institute, Canada. Finex Skills Hub runs the Finex Project in Ghana, a pro bono student training outreach program for students in Data Analytics and Financial Modeling. Bernard also provides consultancy services for SMEs (start-ups and existing) in Financial Management, Business Planning and Research. He has an active audience online with about 17,000 followers on his LinkedIn Account. where he shares tips and tricks on Microsoft Excel and other Office Apps.
Read more about Bernard Obeng Boateng

Right arrow

Inserting slicers for interaction

We have now created all the primary components of our dashboard. At this point, the visuals are not formatted, and they are only flat displays without any interaction.

To bring in some interaction, we will insert slicers to help users dice and slice to bring out some insights from these charts.

We can insert the slicers directly from the data model. To do that, go to Insert > Slicer > Data Model.
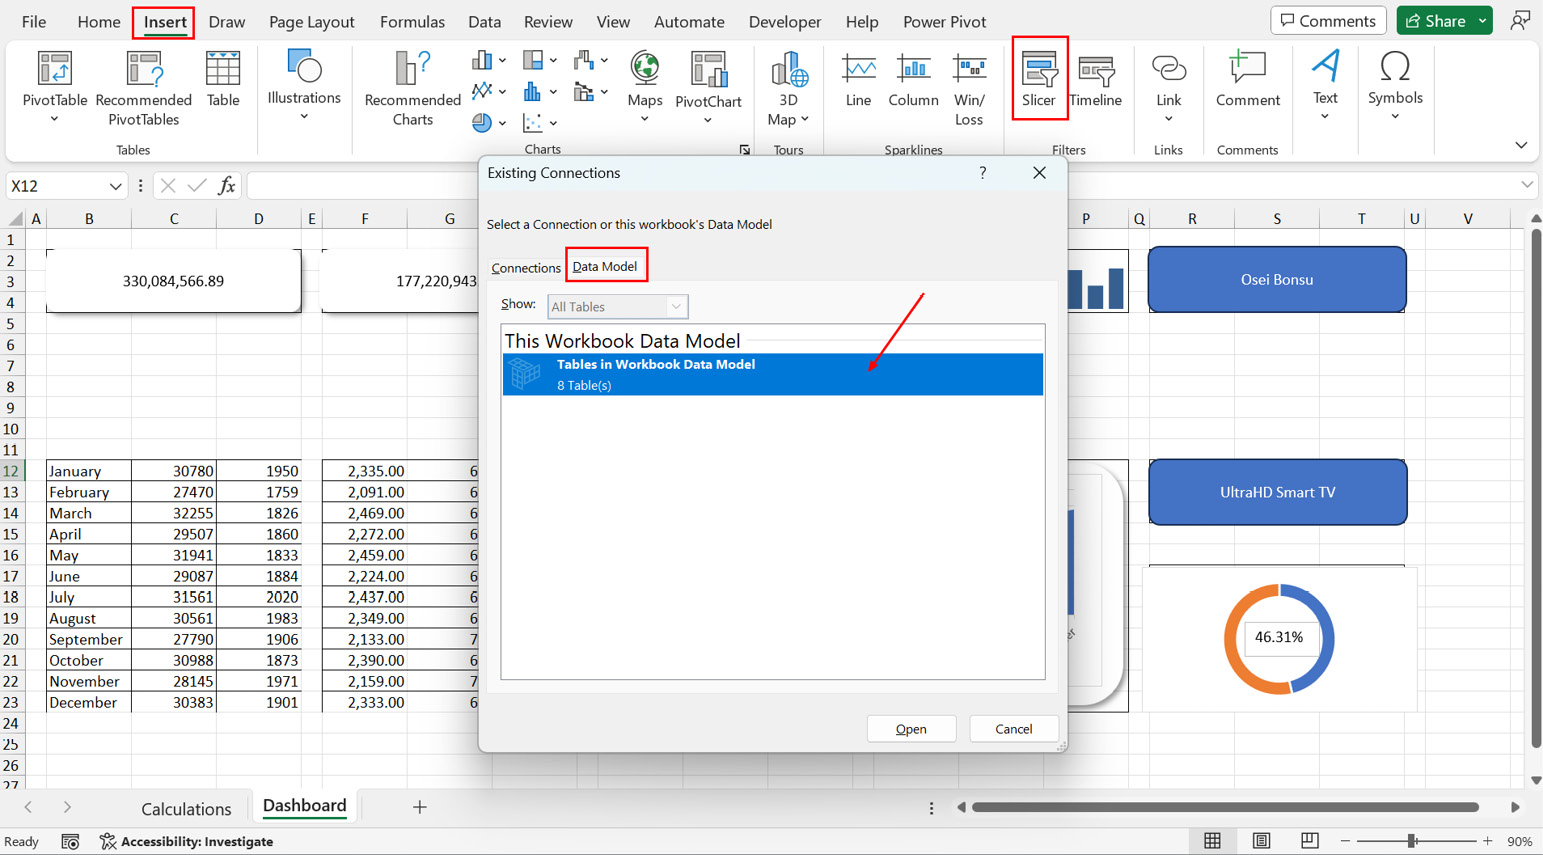
Figure 8.55 – Inserting slicers for interaction

Figure 8.55 – Inserting slicers for interaction

This should bring up all the tables in our data model.

For this dashboard, we want users to slice using Year from the Calendar table and Region from the Location table.

This should bring up the two slicers:
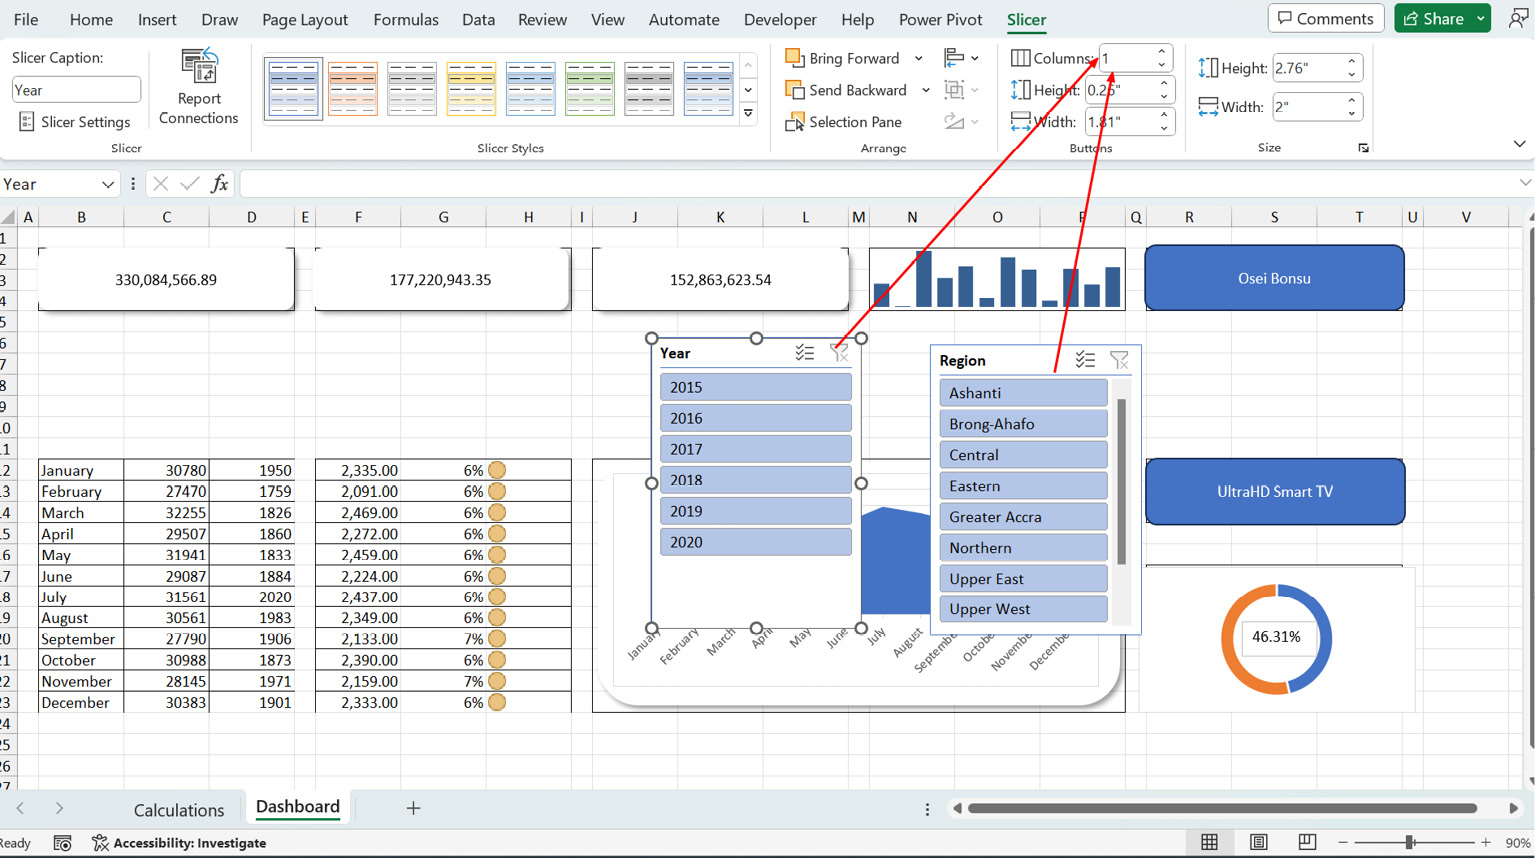
Figure 8.56 – Aligning your slicers

Figure 8.56 – Aligning your slicers

We can split the buttons into columns representing the number of items we have in each slicer. So, we set 6 columns for the Year slicer and 10 for the Region slicer. You can always...

lock icon
The rest of the page is locked
Previous PageNext Page
You have been reading a chapter from
Data Modeling with Microsoft Excel
Published in: Nov 2023Publisher: PacktISBN-13: 9781803240282

Author (1)

author image
Bernard Obeng Boateng

Bernard Obeng Boateng is a Microsoft Excel MVP, Microsoft Certified Trainer, with over 10 years work experience in Banking, Insurance and Business Development. He is founder of Finex Skills Hub an approved Training Provider of the Financial Modeling Institute, Canada. Finex Skills Hub runs the Finex Project in Ghana, a pro bono student training outreach program for students in Data Analytics and Financial Modeling. Bernard also provides consultancy services for SMEs (start-ups and existing) in Financial Management, Business Planning and Research. He has an active audience online with about 17,000 followers on his LinkedIn Account. where he shares tips and tricks on Microsoft Excel and other Office Apps.
Read more about Bernard Obeng Boateng