

Monitoring an Azure SQL database using the Azure portal
Azure SQL Database has built-in monitoring features, such as query performance insights, performance overview, and diagnostic logging. In this recipe, we'll learn how to use the monitoring capabilities using the Azure portal.
Getting ready
We'll use PowerShell to create an Azure SQL database, so open a PowerShell window and log in to your Azure account by executing the Connect-AzAccount command.
We'll use the Azure portal to monitor the Azure SQL database. Open https://portal.azure.com and log in to your Azure account.
How to do it…
First, let's execute a sample workload.
Creating an Azure SQL database and executing a sample workload
- Execute the following PowerShell command to create an Azure SQL database with the
AdventureWorksLTsample database:# create the resource group New-AzResourceGroup -Name packtade -Location "central us" -force #create credential object for the Azure SQL Server admin credential $sqladminpassword = ConvertTo-SecureString 'Sql@Server@1234' -AsPlainText -Force $sqladmincredential = New-Object System.Management.Automation.PSCredential ('sqladmin', $sqladminpassword) # create the azure sql server New-AzSqlServer -ServerName azadesqlserver -SqlAdministratorCredentials $sqladmincredential -Location "central us" -ResourceGroupName packtade #Create the SQL Database New-AzSqlDatabase -DatabaseName adeawlt -Edition basic -ServerName azadesqlserver -ResourceGroupName packtade -SampleName AdventureWorksLT - Execute the following command to add the client IP to the Azure SQL Server firewall:
$clientip = (Invoke-RestMethod -Uri https://ipinfo.io/json).ip
New-AzSqlServerFirewallRule -FirewallRuleName "home" -StartIpAddress $clientip -EndIpAddress $clientip -ServerName azadesqlserver -ResourceGroupName packtade
- Execute the following command to run a workload against the Azure SQL database:
sqlcmd -S azadesqlserver.database.windows.net -d adeawlt -U sqladmin -P Sql@Server@1234 -i "C:\ADECookbook\Chapter02\workload.sql" > "C:\ADECookbook\Chapter02\workload_output.txt"
It can take 4–5 minutes for the workload to complete. You can execute the preceding command multiple times; however, you should run it at least once.
Monitoring Azure SQL database metrics
- In the Azure portal, navigate to All resources | azadesqlserver | the adeawlt database. Search for and open Metrics:

Figure 2.32 – Opening the Metrics section in the Azure portal
The Metrics page allows you to monitor different available metrics over time.
- To select metrics, click Add metric | CPU percentage | Data IO percentage:

Figure 2.33 – Monitoring metrics for a SQL database
We can select the metrics we are interested in monitoring and use the Pin to dashboard feature to pin the chart to the portal dashboard. We can also create an alert rule from the metrics page by clicking on New alert rule. We can select a time range to drill down to specific times or investigates spikes in the chart.
- To select a time range, select the Time range dropdown in the top-right corner of the Metrics page and select the desired time range:
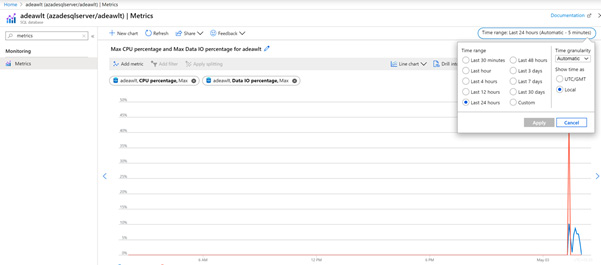
Figure 2.34 – Selecting a time range to monitor
Using Query Performance Insight to find resource-consuming queries
Query Performance Insight is an intelligent performance feature that allows us to find any resource-consuming and long-running queries. The steps are as follows:
- In the Azure portal, navigate to All resources | azadesqlserver | the adeawlt database. Find and open Query Performance Insight:

Figure 2.35 – Selecting Query Performance Insight for the SQL database
- On the Query Performance Insight page, observe that there are three tabs: Resource Consuming Queries, Long Running Queries, and Custom. We can select resource-consuming queries by CPU, Data IO, and Log IO:

Figure 2.36 – Monitoring queries for the SQL database
Resource Consuming Queries lists out the top three queries by CPU consumption. We can also select the top three queries by Data IO and Log IO. The bottom of the page lists out the color-coded queries.
- To get the query text, click on the color-coded box:

Figure 2.37 – Viewing the query details
We can look at the query text and optimize it for better performance.
- The Custom tab allows us to select resource-consuming queries by duration and execution count. We can also specify a custom time range, the number of queries, and the query and metric aggregation:

Figure 2.38 – Providing custom monitoring configuration
- Select the options and click the Go button to refresh the chart as per the custom settings. Long running queries lists out the top three queries by duration:
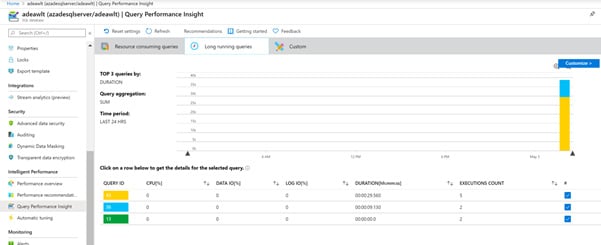
Figure 2.39 – Viewing the long-running queries list
We can further look into the query text and other details by selecting the query ID.
Monitoring an Azure SQL database using diagnostic settings
In addition to metrics and query performance insight, we can also monitor an Azure SQL database by collecting diagnostic logs. The diagnostic logs can be sent to the Log Analytics workspace or Azure Storage, or can be streamed to Azure Event Hubs. The steps are as follows:
- To enable diagnostic logging using the Azure portal, navigate to All resources | azadesqlserver | adeawlt. Find and open Diagnostic settings:

Figure 2.40 – Diagnostic settings
- Click on Add diagnostic setting to add a new diagnostic setting.
- Select the categories to be included in the logs and their destination:

Figure 2.41 – Selecting categories
- Click Save to create the new diagnostic setting. The diagnostic logs can be analyzed in the Log Analytics workspace.
Note:
Diagnostic setting adds an additional cost to the Azure SQL database. It may take some time for the logs to be available after creating a new diagnostic setting.
Automatic tuning in an Azure SQL database
Automatic tuning provides three features: force plan, create, and drop indexes. Automatic tuning can be enabled for an Azure SQL server, in which case it's applied to all of the databases in that Azure SQL server. Automatic tuning can be enabled for individual Azure SQL databases as well. The steps are as follows:
- To enable automatic tuning, in the Azure portal, navigate to All resources | azadesqlserver | adewlt. Find and select Automatic Tuning under Intelligent Performance:

Figure 2.42 – Automatic tuning in the SQL database
- Enable the CREATE INDEX tuning option by clicking ON under the Desired state option.
- Click Apply to save the configuration.
Note
It may take time for recommendations to show up.
The recommendations will show up in the performance recommendations under the Intelligent Performance section.