Reader small image

You're reading from  Learning Tableau 2022 - Fifth Edition

Product typeBook
Published inAug 2022
PublisherPackt
ISBN-139781801072328
Edition5th Edition
Tools
Right arrow
Author (1)
Joshua N. Milligan
Joshua N. Milligan
author image
Joshua N. Milligan

Joshua N. Milligan is a Hall of Fame Tableau Zen Master and 2017 Iron Viz Global finalist. His passion is training, mentoring, and helping people gain insights and make decisions based on their data through data visualization using Tableau and data cleaning and structuring using Tableau Prep. He is a principal consultant at Teknion Data Solutions, where he has served clients in numerous industries since 2004.
Read more about Joshua N. Milligan

Right arrow

Understanding the Tableau Data Model, Joins, and Blends

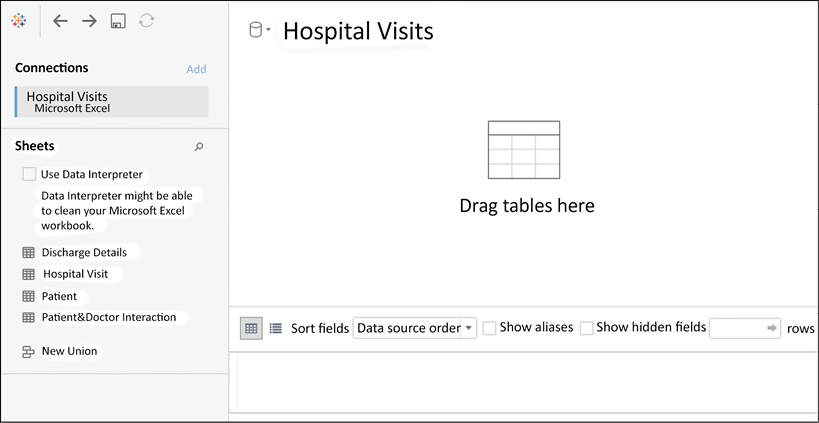
In this chapter, we’ll gain a deeper understanding of how to model and structure data with Tableau. We’ve seen the Data Source screen in previous chapters and briefly explored how to drag and drop tables to form relationships. Now, we’ll explore some of Tableau’s more complex features to gain a good understanding of how Tableau allows you to relate multiple tables together, either logically or physically.

We’ll start with a broad overview of Tableau’s new data model and then examine some details of different types of joins and blends. The data model and blending apply primarily to Tableau Desktop (and Server), but pay special attention to the discussion of joins, as a good understanding of join types will aid you greatly when we discuss Tableau preparation in Chapter 16, Taming Data with Tableau Prep.

The data model was introduced in Tableau 2020.2. If you are using an...

Explanation of the sample data used in this chapter

For this chapter, we’ll use a sample dataset of patient visits to the hospital. The data itself is contained in the Excel file Hospital Visits.xlsx in the Learning Tableau\Chapter 14 directory. In this example, each tab of the Excel file represent tables of data. The principles described here are directly applicable to relational database tables, multiple files, or tables in any data source. The relationship between those tables is illustrated here:

Figure 14.1: The four tabs of the Excel file illustrated as four tables with relationships

Excel does not explicitly define the relationships, but they are shown here as they might exist in a relational database using foreign key lookups. Here is a brief explanation of the tables and their relationships:

  • Hospital Visit: This is the primary table that records the admission and diagnosis of a single patient on a single visit to the hospital. It contains attributes...

Exploring the Tableau data model

Every data source you create in Tableau will use the data model. Any time you relate two or more sets of data, you’ll need to give some thought as to the various ways you might relate them in the data model. We’ll cover some of the basics of what a data model is and how to create it first.

Creating a data model

We’ve briefly looked at the Data Source screen in Chapter 2, Connecting to Data in Tableau. Now, we’ll take a deeper look at the concepts behind the interface. Feel free to follow along with the following example in the Chapter 14 Starter.twb workbook, or examine the end results in Chapter 14 Complete.twbx.

We’ll start by creating a connection to the Hospital Visits.xlsx file in the Chapter 14 directory. The Data Source screen will look like this upon first connecting to the file:

Figure 14.2: The Data Source screen lists the tabs in the Excel workbook and invites you to start a data model...

Using joins

A join at the physical level is a row-by-row matching of the data between tables. We’ll look at some different types of joins and then consider how to leverage them in the physical layer of a data model.

Types of joins

In the physical layer, you may specify the following types of joins:

  • Inner: Only records that match the join condition from both the table on the left and the table on the right will be kept. In the following example, only three matching rows are kept in the results:
Chart  Description automatically generated

Figure 14.12: Inner join

  • Left: All records from the table on the left will be kept. Matching records from the table on the right will have values in the resulting table, while unmatched records will contain NULL values for all fields from the table on the right.

    In the following example, the five rows from the left table are kept, with NULL results for any values in the right table that were not matched:

    Figure 14.13: Left join...

Using blends

Data blending allows you to use data from multiple data sources in the same view. Often, these sources may be of different types. For example, you can blend data from Oracle with data from Excel. You can blend Google Analytics data with a spatial file. Data blending also allows you to compare data at different levels of detail. Let’s consider the basics and a simple example.

Data blending is done at an aggregate level and involves different queries sent to each data source, unlike joining, which is done at the row level and (conceptually) involves a single query to a single data source. A simple data blending process involves several steps, as shown in the following diagram:

Figure 14.26: How Tableau accomplishes blending

We can see the following from the preceding diagram:

  1. Tableau issues a query to the primary data source.
  2. The underlying data engine returns aggregate results.
  3. Tableau issues another query to the secondary...

When to use a data model, joins, or blends

In one sense, every data source you create using the latest versions of Tableau will use a data model. Even data sources using one physical table will have a corresponding object in the logical layer of a data model. But when should you relate tables using the data model, when should you join them together in the physical layer, and when should you employ blending?

Most of the time, there’s no single right or wrong answer. However, here are some general guidelines to help you think through when it’s appropriate to use a given approach.

In general, use a data model to relate tables:

  • When joins would make correct aggregations impossible or require complex LOD expressions to get accurate results
  • When joins would result in unwanted duplication of data
  • When you need flexibility in showing full domains of dimensions versus only values that match across relationships
  • When you are uncertain of a...

Summary

You now have several techniques to turn to when you need to relate tables of data together. The data model gives a paradigm for relating logical tables of data together. It introduces a few behaviors when it comes to showing the full and partial domains of dimensional values, but it also greatly simplifies aggregations by taking into account the natural level of detail for the aggregation. In the physical layer, you have the option of joining together physical tables.

We covered the various types of joins and discussed possibilities for using join calculations and cross-database joins for ultimate flexibility. We briefly discussed how data blending works and saw a practical example. Finally, you examined a broad outline of when to turn to each approach. You now have a broad toolset to tackle data in different tables or even in different databases or files.

We’ll expand that toolset quite a bit more in the next chapter as we look at Tableau Prep Builder. Tableau...

lock icon
The rest of the chapter is locked
You have been reading a chapter from
Learning Tableau 2022 - Fifth Edition
Published in: Aug 2022Publisher: PacktISBN-13: 9781801072328
Register for a free Packt account to unlock a world of extra content!
A free Packt account unlocks extra newsletters, articles, discounted offers, and much more. Start advancing your knowledge today.
undefined
Unlock this book and the full library FREE for 7 days
Get unlimited access to 7000+ expert-authored eBooks and videos courses covering every tech area you can think of
Renews at $15.99/month. Cancel anytime

Author (1)

author image
Joshua N. Milligan

Joshua N. Milligan is a Hall of Fame Tableau Zen Master and 2017 Iron Viz Global finalist. His passion is training, mentoring, and helping people gain insights and make decisions based on their data through data visualization using Tableau and data cleaning and structuring using Tableau Prep. He is a principal consultant at Teknion Data Solutions, where he has served clients in numerous industries since 2004.
Read more about Joshua N. Milligan