Reader small image

You're reading from  Learning Tableau 2022 - Fifth Edition

Product typeBook
Published inAug 2022
PublisherPackt
ISBN-139781801072328
Edition5th Edition
Tools
Right arrow
Author (1)
Joshua N. Milligan
Joshua N. Milligan
author image
Joshua N. Milligan

Joshua N. Milligan is a Hall of Fame Tableau Zen Master and 2017 Iron Viz Global finalist. His passion is training, mentoring, and helping people gain insights and make decisions based on their data through data visualization using Tableau and data cleaning and structuring using Tableau Prep. He is a principal consultant at Teknion Data Solutions, where he has served clients in numerous industries since 2004.
Read more about Joshua N. Milligan

Right arrow

Exploring Mapping and Advanced Geospatial Features

Up until now, we’ve seen examples of maps and geospatial visualizations that leverage some of the basic functionality of Tableau. In this chapter, we’ll embark on a journey to uncover the vast range of mapping and geospatial features available. From using the built-in geospatial database and supplementing it with additional data and spatial files to using advanced geospatial functions, we’ll explore what’s possible with Tableau.

As we’ve done previously, this chapter will approach the concepts through some practical examples. These examples will span various industries, including real estate, transportation, and healthcare. As always, these examples are broadly applicable, and you’ll discover many ways to leverage your data and uncover answers in the spatial patterns you’ll find.

In this chapter, we’ll cover the following topics:

  • Overview of Tableau maps
  • ...

Overview of Tableau maps

Tableau contains an internal geographic database that allows it to recognize common geographic elements and render a mark at a specific latitude and longitude on a map. In many cases, such as with a country or state, Tableau also contains internal shapefiles that allow it to render the mark as a complex vector shape in the proper location. Tableau also leverages your specific geospatial data, such as latitude and longitude, shapefiles, and spatial objects. We’ll consider some of those possibilities throughout this chapter. For now, we’ll walk through some of the basics of how Tableau renders maps and some of the customizations and options available.

Rendering maps with Tableau

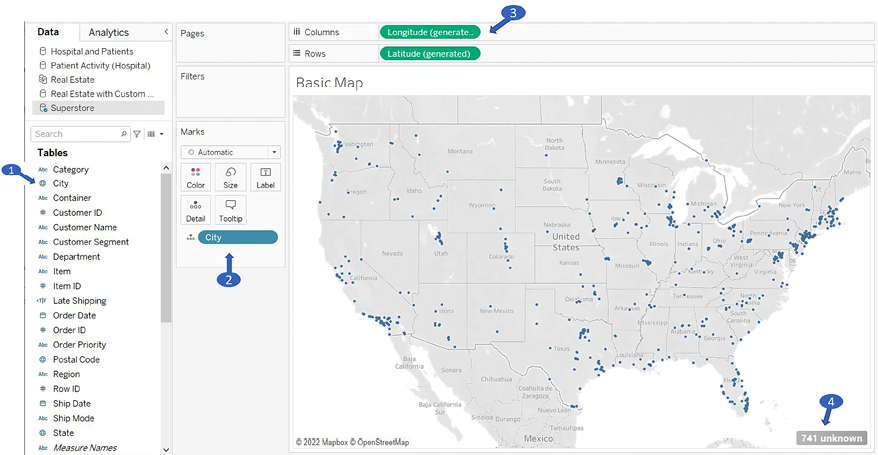
Consider the following screenshot (the Basic Map example in the Chapter 12 workbook), with certain elements numbered for reference:

Figure 12.1: A basic geospatial rendering in Tableau

The numbers indicate some of the important aspects of Tableau’s ability to render maps:

  1. A geographic field in the data is indicated with a globe icon. Fields that Tableau recognizes will have this icon by default. You may assign a geographic role to any field by using the menu and selecting Geographic Role.
  2. The geographic field in the view (in this case, on Detail) is required to render the map.
  3. If Tableau is able to match the geographic field with its internal database, the Latitude (generated) and Longitude (generated) fields placed on Rows and Columns along with the geographic field(s) on the Marks card will render a map.
  4. Values that don’t find a match with Tableau’s geographic database (for example, invalid...

Using geospatial data

We’ve seen that with any data source, Tableau supplies Latitude (generated) and Longitude (generated) fields based on any fields it matches with its internal geographic database. Fields such as country, state, zip code, MSA, and congressional district are contained in Tableau’s internal geography. As Tableau continues to add geographic capabilities, you’ll want to consult the documentation to determine specifics on what the internal database contains.

However, you can also leverage specific geospatial data in your visualizations. We’ll consider ways to use data that enable geospatial visualizations, including the following:

  • Including Latitude and Longitude as values in your data
  • Importing a .csv file containing definitions of Latitude and Longitude in Tableau’s database
  • Leveraging Tableau’s ability to connect to various spatial files or databases that natively support spatial objects
...

Leveraging spatial functions

Tableau continues to add native support for spatial functions. At the time of writing, Tableau supports the following functions:

  • Area() returns the total area of a polygon spatial object. You may specify the units of measurement as either meters, kilometers, miles, or feet.
  • Makeline() returns a line spatial object given two points.
  • Makepoint() returns a point spatial object given two coordinates.
  • Distance() returns the distance between two points in the desired units of measurement.
  • Buffer() creates a circle around a point with a radius of the given distance. As with the Area function, you may specify the units of measurement.

We’ll explore a few of these functions using the Hospital and Patients dataset in the Chapter 12 workbook. The dataset reimagines the real estate data as a hospital surrounded by patients, indicated in the following view by the difference in Shape, Size, and Color:

Figure...

Creating custom territories

Custom territories are geographic areas or regions that you create (or that the data defines) as opposed to those that are built in (such as country or area code). Tableau gives you two options for creating custom territories: ad hoc custom territories and field-defined custom territories. We’ll explore these next.

Ad hoc custom territories

You can create custom territories in an ad hoc way by selecting and grouping marks on a map. Simply select one or more marks, hover over one, and then use the Group icon. Alternately, right-click one of the marks to find the option. You can create custom territories by grouping by any dimension if you have latitude and longitude in the data or any geographic dimension if you are using Tableau’s generated latitude and longitude.

Here, using the Real Estate with Custom Territories data source, we’ll consider an example using zip code:

Figure 12.15: After selecting the filled regions...

Map layers

Map layers were introduced in Tableau 2020.4 and make it easy to bring together a wide range of geospatial data from your data source(s) into a single map. Consider for example the Real Estate with Custom Territories data source we used in the previous example. It contains numerous geographic data, including:

  • City
  • State
  • Zip code
  • Region (created as a field-defined custom territory in the previous example)
  • Latitude and longitude (of the individual houses for sale)

Let’s say we want to create a map that brings much of this together, showing the individual houses as circles sized by price, along with an indication of the zip codes and the custom regions we defined previously with a label indicating the average price for the region.

The main key to leveraging layers is to make certain that Tableau’s special Longitude (generated) and Latitude (generated) are the fields used on Columns and Rows. Any geographic fields...

Tableau mapping – tips and tricks

There are a few other tips to consider when working with geographic visualizations:

  • Use the top menu to select Map | Background Layers for numerous options for what layers of background to show as part of the map.
  • Other options for zooming include using the mouse wheel, double-clicking, Shift + Alt + clicking, and Shift + Alt + Ctrl + clicking.
  • You can click and hold for a few seconds to switch to pan mode.
  • You can show or hide the zoom controls and/or map search by right-clicking the map and selecting the appropriate option.
  • Zoom controls can be shown on any visualization type that uses an axis.
  • The pushpin on the zoom controls alternately returns the map to the best fit of visible data or locks the current zoom and location.
  • While Background Layers will often be your go-to solution for layering multiple sets of geospatial data on a map, you might also create a dual-axis map by duplicating (Ctrl...

Plotting data on background images

Background images allow you to plot data on top of any image. Consider the possibilities! You could plot ticket sales by seat on an image of a stadium, room occupancy on the floor plan of an office building, the number of errors per piece of equipment on a network diagram, or meteor impacts on the surface of the moon.

In this example, we’ll plot the number of patients per month in various rooms in a hospital. We’ll use two images of floorplans for the ground floor and the second floor of the hospital. The data source is located in the Chapter 12 directory and is named Hospital.xlsx. It consists of two tabs: one for patient counts and another for room locations based on the x/y coordinates mapped to the images. We’ll shortly consider how that works. You can view the completed example in the Chapter 12 Complete.twbx workbook or start from scratch using Chapter 12 Starter.twbx.

To specify a background image, use the top...

Summary

We’ve covered a lot of ground in this chapter! The basics of visualizing maps are straightforward, but there is a lot of power and possibility behind the scenes. From using your own geospatial data to leveraging geospatial objects and functions and potentially layering a lot of information on a single map, you have a lot of analytical options. Creating custom territories and plotting data on background images expand your possibilities even further.

Next, we’ll introduce some capabilities that greatly expand the functionality of Tableau. In fact, you’ll even write your own code in Python, R, and JavaScript and see the power of Einstein to extend your analytics, dashboards, and interactivity to a whole new level!

Join our community on Discord

Join our community’s Discord space for discussions with the author and other readers: https://packt.link/ips2H

lock icon
The rest of the chapter is locked
You have been reading a chapter from
Learning Tableau 2022 - Fifth Edition
Published in: Aug 2022Publisher: PacktISBN-13: 9781801072328
Register for a free Packt account to unlock a world of extra content!
A free Packt account unlocks extra newsletters, articles, discounted offers, and much more. Start advancing your knowledge today.
undefined
Unlock this book and the full library FREE for 7 days
Get unlimited access to 7000+ expert-authored eBooks and videos courses covering every tech area you can think of
Renews at $15.99/month. Cancel anytime

Author (1)

author image
Joshua N. Milligan

Joshua N. Milligan is a Hall of Fame Tableau Zen Master and 2017 Iron Viz Global finalist. His passion is training, mentoring, and helping people gain insights and make decisions based on their data through data visualization using Tableau and data cleaning and structuring using Tableau Prep. He is a principal consultant at Teknion Data Solutions, where he has served clients in numerous industries since 2004.
Read more about Joshua N. Milligan