
Data Modeling Components
In the previous chapter, we learned about some critical data preparation best practices, such as loading a proportion of data, removing unnecessary columns, and summarization to optimize our data model size. We also learned about query folding and how it can affect our data modeling in Power BI. We also looked at data type conversion and discussed the importance of selecting certain data types to keep our data model more optimized when we import the data into the data model; that brings us to this chapter. All our data preparation efforts pay off by having a cleaner data model that is easier to maintain and performs well. This chapter looks more closely at data modeling in Power BI by covering the following topics:
- Data modeling in Power BI Desktop
- Understanding tables
- Understanding fields
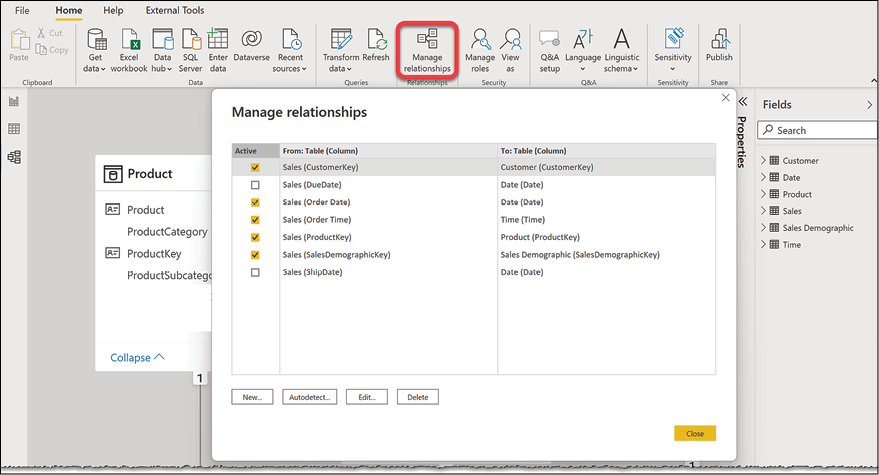
- Using relationships
We use the Chapter 8, Data Modeling and Star Schema.pbix sample file in this chapter. It is a copy of the sample...