Reader small image

You're reading from  Sencha Charts Essentials

Product typeBook
Published inMay 2015
Reading LevelBeginner
Publisher
ISBN-139781785289767
Edition1st Edition
Languages
Right arrow
Author (1)
Ajit Kumar
Ajit Kumar
author image
Ajit Kumar

Ajit Kumar has over 16 years of experience in technology areas ranging from embedded systems to large enterprise applications. He worked with various multinational corporations such as Honeywell, Hughes, Virtusa, and Convergys, before starting his own companyWalking Treewhich specializes in Sencha frameworks. Ajit has authored books on open source frameworks, including Sencha Touch Cookbook, Sencha Touch Cookbook Second Edition, Sencha MVC Architecture, and ADempiere 3.6 Cookbook, all by Packt Publishing, which he considers his way of thanking the awesome open source community!
Read more about Ajit Kumar

Right arrow

Chapter 9. Comparison with Other JavaScript Charting Libraries

Besides Sencha Charts, there are various other charting libraries that are popular and in use. Each library offers a charting capability in its own unique way. In this chapter, we will talk about the following charting libraries and see how we can create a chart similar to what we created in Chapter 7, Theming, using Sencha Charts:

  • Google Charts

  • FusionCharts

  • amCharts

  • HighCharts

This chapter will not recommend which charting library you should use, rather, it will only showcase how the respective charting APIs can be used to create a chart, which will give you an idea about the development approach that you will need when you intend to use a particular library. It will also give you an idea about how these approaches and APIs differ from those of Sencha Charts.

In Chapter 7, Theming, we produced the following chart using the Sencha Charts library:

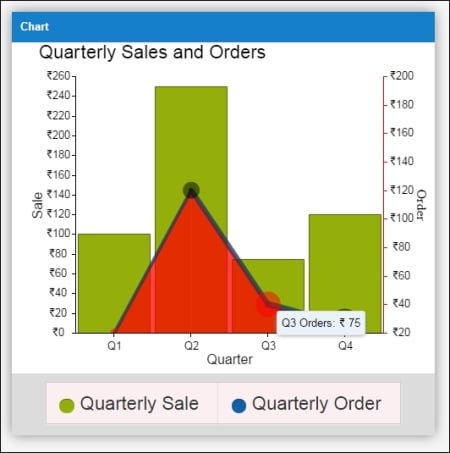
Looking at this chart, we can derive the following requirements for our chart, which we...

Google Charts


Google Charts is a data visualization library from Google. It renders charts using SVG and VML (for older IE versions), and offers cross-platform portability to iPhones, iPads, and Android.

Let's follow these steps to create the desired chart using Google Charts:

  1. Create the ch09/GoogleCharts folder.

  2. Create the index.html file and save the following code in it:

    <html>
      <head>
        <script type="text/javascript" src="https://www.google.com/jsapi"></script>
    
        <script type="text/javascript" src="app.js"></script>
      </head>
    
      <body>
        <div id="chartdiv" style="width:600; height:500"></div>
      </body>
    </html>
  3. Create the app.js file and save the following code in it:

    google.load('visualization', '1.0', {'packages':['corechart']});
    
    // Set a callback to run when the Google Visualization API is loaded.
    google.setOnLoadCallback(drawChart);
    
    function drawChart() {
    
            var data = new google.visualization.arrayToDataTable...

FusionCharts


This is one of the most comprehensive open charting libraries in terms of different types of charts supported by a JS charting library. Like Google Charts, FusionCharts also renders charts using SVG and VML.

We will create the chart based on the following steps:

  1. Create the ch09/FusionCharts folder.

  2. Create the index.html file and save the following code in it:

    <!DOCTYPE html PUBLIC "-//W3C//DTD XHTML 1.0 Transitional//EN" "http://www.w3.org/TR/xhtml1/DTD/xhtml1-transitional.dtd">
    <html xmlns="http://www.w3.org/1999/xhtml">
    <head>
      <title>FusionCharts</title>
      <meta http-equiv="Content-Type" content="text/html; charset=UTF-8">
    
      <script src="sdk/js/fusioncharts.js"></script>
      <script type="text/javascript" src="sdk/js/themes/fusioncharts.theme.fint.js"></script>
    
      <script type="text/javascript" src="themes/awesome.js"></script>
      <script type="text/javascript" src="app_themed.js"></script>
    
    <...

amCharts


amCharts is a responsive modern charting library that renders charts using SVG and is supported by touch or mobile devices.

Let's create the chart by performing the following steps:

  1. Create the ch09/amCharts folder.

  2. Create the index.html file and save the following code inside it:

    <!DOCTYPE html PUBLIC "-//W3C//DTD XHTML 1.0 Transitional//EN" "http://www.w3.org/TR/xhtml1/DTD/xhtml1-transitional.dtd">
    <html xmlns="http://www.w3.org/1999/xhtml">
    <head>
      <title>amCharts</title>
      <meta http-equiv="Content-Type" content="text/html; charset=UTF-8">
      <script type="text/javascript" src="http://www.amcharts.com/lib/3/amcharts.js"></script>
      <script type="text/javascript" src="http://www.amcharts.com/lib/3/serial.js"></script>
      <script type="text/javascript" src="http://www.amcharts.com/lib/3/themes/none.js"></script>
    
      <script type="text/javascript" src="themes/awesome.js"></script>
    
      <script type="text...

HighCharts


Like other JS charting libraries that we talked about, HighCharts also renders charts using SVG. We will create the desired chart using this library using the following steps:

  1. Create the ch09/HighCharts folder.

  2. Create the index.html file and save the following code in it:

    <!DOCTYPE html PUBLIC "-//W3C//DTD XHTML 1.0 Transitional//EN" "http://www.w3.org/TR/xhtml1/DTD/xhtml1-transitional.dtd">
    <html xmlns="http://www.w3.org/1999/xhtml">
    <head>
      <title>HighCharts</title>
      <meta http-equiv="Content-Type" content="text/html; charset=UTF-8">
    
      <script src="//code.jquery.com/jquery-1.11.2.min.js"></script>
      <script src="//code.jquery.com/jquery-migrate-1.2.1.min.js"></script>
    
      <script src="http://code.highcharts.com/highcharts.js"></script>
    
      <script type="text/javascript" src="themes/awesome.js"></script>
      <script type="text/javascript" src="app_themed.js"></script>
    
      <style>...

Summary


We started this book with a discussion on the SVG and Canvas APIs and you learned about the fundamentals of charting. After that, you learned about the Sencha Charts package and created different types of interactive charts using its out-of-the-box capabilities. Next, you learned about creating custom cartesian, polar, and spacefilling charts and also created gestures-based custom interactions. Finally, we saw how to style and theme a Sencha Charts-based chart.

In this chapter, we took a Sencha Charts-based chart, which we had created earlier, as a case study and tried to create a similar chart using various, popularly used JavaScript charting libraries—Google Charts, FusionCharts, amCharts, and HighCharts. It showed how the libraries differ in terminologies, APIs, properties, theming mechanism, and customization possibilities. This will help us to compare different charting libraries and see how they fair with Sencha Charts.

lock icon
The rest of the chapter is locked
You have been reading a chapter from
Sencha Charts Essentials
Published in: May 2015Publisher: ISBN-13: 9781785289767
Register for a free Packt account to unlock a world of extra content!
A free Packt account unlocks extra newsletters, articles, discounted offers, and much more. Start advancing your knowledge today.
undefined
Unlock this book and the full library FREE for 7 days
Get unlimited access to 7000+ expert-authored eBooks and videos courses covering every tech area you can think of
Renews at $15.99/month. Cancel anytime

Author (1)

author image
Ajit Kumar

Ajit Kumar has over 16 years of experience in technology areas ranging from embedded systems to large enterprise applications. He worked with various multinational corporations such as Honeywell, Hughes, Virtusa, and Convergys, before starting his own companyWalking Treewhich specializes in Sencha frameworks. Ajit has authored books on open source frameworks, including Sencha Touch Cookbook, Sencha Touch Cookbook Second Edition, Sencha MVC Architecture, and ADempiere 3.6 Cookbook, all by Packt Publishing, which he considers his way of thanking the awesome open source community!
Read more about Ajit Kumar