Reader small image

You're reading from  Microsoft Visio 2010 Business Process Diagramming and Validation

Product typeBook
Published inJul 2010
Reading LevelIntermediate
PublisherPackt
ISBN-139781849680141
Edition1st Edition
Languages
Right arrow
Author (1)
David Parker
David Parker
author image
David Parker

David J Parker's background has been in data visualization ever since he struggled to produce lists of hospital equipment from Computer Aided Design models of buildings as a budding architect in the '80s. He moved into building and infrastructure asset management in the late '80s using a Unix system and gradually migrated to Windows-based systems throughout the '90s. He became a European Business partner of Visio Corporation in 1996 and presented the database-linked Visio solutions that he was providing merchant banks in London and New York with at several international conferences. David started bVisual Ltd. in 1998, which provides Visio-based solutions to various industries, and became a Silver-level Microsoft partner. He has been a Microsoft MVP (Visio) for the last 12 years and has helped Microsoft Corp, UK and Western Europe, by providing Visio solutions, training, website content, and presentations. David has had several books on Visio published and has been presenting Visio/SharePoint integration courses for many years for Microsoft Western Europe, from Oslo in the North down to Lisbon in the South. He has presented at SQL and SharePoint Saturday conferences and writes a regular blog for people interested in Microsoft Visio.
Read more about David Parker

Right arrow

Chapter 9. A Worked Example for Data Flow Model Diagrams

In the preceding chapters, we learned about the Visio object model, the new Validation API, how to write validation rules, and how to publish these rules for others to use.

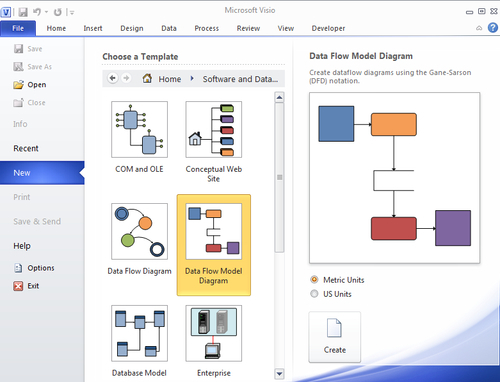
In this chapter, we are going to present a complete cycle for writing validation rules for the Data Flow Model Diagram methodology. I chose this template because there used to be an add-on associated with it in Visio, but this add-on is no longer provided, and there are no rules for it either.

As we are going to be producing a new template, we can take the opportunity to enhance the Master shapes too. I know that some of these enhancements are usually done by a ShapeSheet developer rather than a rules developer, but I include fairly-detailed steps because they give valuable insight into Visio shape behavior.

So, in this chapter, we will go through the following steps:

  • Examining the existing template

  • Making any shape enhancements we may want

  • Analyzing the rules requirements...

What are Data Flow Diagrams?


A quick search on the Web reveals that Data Flow Diagrams (DFDs) are a graphical representation of the flow of data into, around, and out of a system.

Throughout the seventies, various academics developed methodologies for modeling data flows. The one by Gane and Sarson is utilized in the Data Flow Model Diagrams template in Visio. This methodology has the following four elements:

  • Squares representing external entities, which are sources or destinations of data. These are the places that provide the organization with data, or have data sent to them by the organization (for example, customers, partners, government bodies).

  • Rounded rectangles representing processes, which take data as input, do something to it, and output it.

  • Arrows representing the data flows, which can be either...

Examining the standard template


You can find the standard Data Flow Model Diagram template in the Software and Databases category.

If you create a new document from this template, you will see that there are just four masters on the Gane-Sarson stencil, and there are no rules associated with it at all.

If you then drag-and-drop just one of each shape onto the page, you will see that the graphics are not complicated either.

You now need to review the current shapes, and one way to do this is to create a quick report in Visio. I started by reviewing the ShapeSheet of each of the shapes and saw that each of them contain a few User-defined Cells that point to their role within UML diagrams. For example, the User.UMLShapeType cell contains a numerical value that specifies the type of UML shape, and the User.visDescription cell contains a text description of this type.

So, you can create a new report that lists all of the shapes on the current page using the Shape Reports button in the Reports...

Writing the rule set


In Chapter 4 you learned how to write VBA code to add a rule set and rules, and, although you could repeat this throughout the rest of this chapter, I prefer to use the user interface that we developed in chapters 6 and 7. Therefore, you will need to install the Rules Tools add-in or run the Validation Explorer solution from Visual Studio 2010, in order to write the rules easily. However, I have included VBA methods to add (or update) the rule set and rules, which can be written into the VBA project of any Visio document, but should be run when the document that you want to add the rules to is active.

Open the Rules Explorer window from the Rules Tools group on the Process tab.

With your document node selected in the Rules Explorer window, click the Add button, then enter the Name, Name U, and Description of this new rule set.

You can now add each of the new rules by translating the previous descriptions into validation formulae.

The equivalent VBA code is listed below...

Completing the template


Now that you have modified the masters, written the validation rules, and enhanced the first page, you need to put the finishing touches to the template before creating an installation file.

Follow the instructions in Chapter 8 to add a title block, select a theme, and to insert the page name field into the title shape in the background page. Then save your document as a template DFMD_M.vst, if it is metric units, or DFMD_U.vst, if it is US units.

Test your template by creating a new document from it, and then resize the first page to be square.

Note

If you hold down the Ctrl key and move your mouse cursor to the top of the page, then you will see that the cursor changes to a vertical two-way arrow. You can then click and drag the top edge of the page downwards, whilst still holding down the Ctrl key, until the page looks square.

Now arrange some of the DFD shapes on the page as this page will be used as the preview image on your new template. Follow the instructions...

Summary


Well, that's all folks!

You have learnt a lot about how Visio works, both for the ShapeSheet and for automation. In particular, you have done the following:

  • Written VBA code to examine the Visio objects and properties

  • Written a VSTO add-in in C# to enable you to edit or export rule sets

  • Analyzed how the built-in rule sets in Visio 2010 Premium edition are implemented

  • Learned how to write validation rules that can enforce standards within your organization

  • Learnt how to create a professional installation for a custom template, so that your rules can be easily used by others

Validation ensures that structured diagrams, such as business process flows, are well constructed. These validated diagrams could then be used to generate data for other systems now that you can be content that they have been correctly drawn, connected, labeled, or assigned data values.

I think that there are many other structured diagramming types that could benefit from having validation rules. These do not have to be...

lock icon
The rest of the chapter is locked
You have been reading a chapter from
Microsoft Visio 2010 Business Process Diagramming and Validation
Published in: Jul 2010Publisher: PacktISBN-13: 9781849680141
Register for a free Packt account to unlock a world of extra content!
A free Packt account unlocks extra newsletters, articles, discounted offers, and much more. Start advancing your knowledge today.
undefined
Unlock this book and the full library FREE for 7 days
Get unlimited access to 7000+ expert-authored eBooks and videos courses covering every tech area you can think of
Renews at $15.99/month. Cancel anytime

Author (1)

author image
David Parker

David J Parker's background has been in data visualization ever since he struggled to produce lists of hospital equipment from Computer Aided Design models of buildings as a budding architect in the '80s. He moved into building and infrastructure asset management in the late '80s using a Unix system and gradually migrated to Windows-based systems throughout the '90s. He became a European Business partner of Visio Corporation in 1996 and presented the database-linked Visio solutions that he was providing merchant banks in London and New York with at several international conferences. David started bVisual Ltd. in 1998, which provides Visio-based solutions to various industries, and became a Silver-level Microsoft partner. He has been a Microsoft MVP (Visio) for the last 12 years and has helped Microsoft Corp, UK and Western Europe, by providing Visio solutions, training, website content, and presentations. David has had several books on Visio published and has been presenting Visio/SharePoint integration courses for many years for Microsoft Western Europe, from Oslo in the North down to Lisbon in the South. He has presented at SQL and SharePoint Saturday conferences and writes a regular blog for people interested in Microsoft Visio.
Read more about David Parker