

Filtering data
Often, you will want to filter data in Tableau in order to perform an analysis on a subset of data, narrow your focus, or drill into details. Tableau offers multiple ways to filter data.
If you want to limit the scope of your analysis to a subset of data, you can filter the data at the source using one of the following techniques:
- Data Source Filters are applied before all other filters and are useful when you want to limit your analysis to a subset of data. These filters are applied before any other filters.
- Extract Filters limit the data that is stored in an extract (
.tdeor.hyper). Data source filters are often converted into extract filters if they are present when you extract the data. - Custom SQL Filters can be accomplished using a live connection with custom SQL, which has a Tableau parameter in the
WHEREclause. We'll examine parameters in Chapter 4, Starting an Adventure with Calculations and Parameters.
Additionally, you can apply filters to one or more views using one of the following techniques:
- Drag and drop fields from the data pane to the Filters shelf.
- Select one or more marks or headers in a view and then select Keep Only or Exclude, as shown here:

Figure 2.25: Based on the mark selection, you may Keep Only values that match or Exclude such values.
- Right-click any field in the data pane or in the view and select Show Filter. The filter will be shown as a control (examples include a drop-down list and checkbox) to allow the end user of the view or dashboard the ability to change the filter.
- Use an action filter. We'll look more at filters and action filters in the context of dashboards.
Each of these options adds one or more fields to the Filters shelf of a view. When you drop a field on the Filters shelf, you will be prompted with options to define the filter. The filter options will differ most noticeably based on whether the field is discrete or continuous. Whether a field is filtered as a dimension or as a measure will greatly impact how the filter is applied and the results.
Filtering discrete (blue) fields
When you filter using a discrete field, you will be given options for selecting individual values to keep or exclude. For example, when you drop the discrete Department dimension onto the Filters shelf, Tableau will give you the following options:
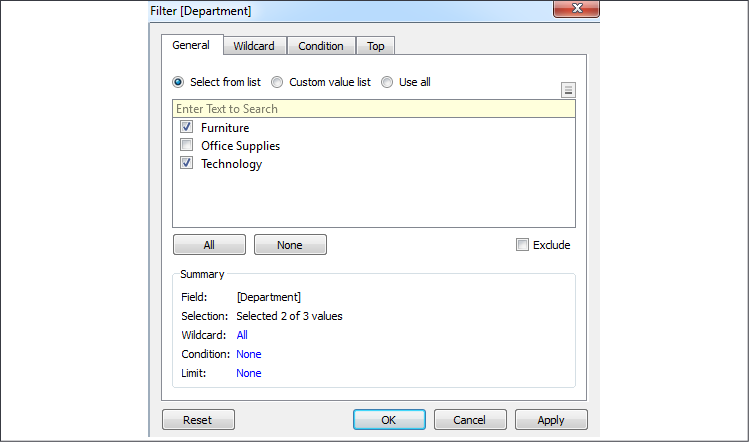
Figure 2.26: A filter for a discrete field will show options for including or excluding individual values
The Filter options include General, Wildcard, Condition, and Top tabs. Your filter can include options from each tab. The Summary section on the General tab will show all options selected:
- The General tab allows you to select items from a list (you can use the custom list to add items manually if the dimension contains a large number of values that take a long time to load). You may use the Exclude option to exclude the selected items.
- The Wildcard tab allows you to match string values that contain, start with, end with, or exactly match a given value.
- The Condition tab allows you to specify conditions based on aggregations of other fields that meet conditions (for example, a condition to keep any Department where the sum of sales was greater than $1,000,000). Additionally, you can write a custom calculation to form complex conditions. We'll cover calculations more in Chapter 4, Starting an Adventure with Calculations and Parameters, and Chapter 6, Diving Deep with Table Calculations.
- The Top tab allows you to limit the filter to only the top or bottom items. For example, you might decide to keep only the top five items by the sum of sales.
Discrete measures (except for calculated fields using table calculations) cannot be added to the Filters shelf. If the field holds a date or numeric value, you can convert it to a continuous field before filtering. Other data types will require the creation of a calculated field to convert values you wish to filter into continuous numeric values.
Let's next consider how continuous filters are filtered.
Filtering continuous (green) fields
If you drop a continuous dimension onto the Filters shelf, you'll get a different set of options. Often, you will first be prompted as to how you want to filter the field, as follows:
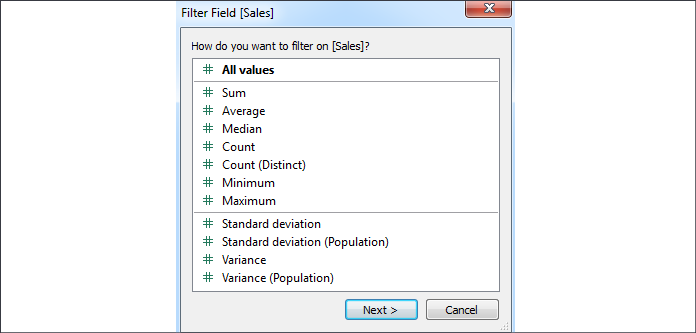
Figure 2.27: For numeric values, you'll often see options for aggregating the value as part of the filter
The options here are divided into two major categories:
- All values: The filter will be based on each individual value of the field, row by row. For example, an All values filter keeping only sales above $100 will evaluate each record of underlying data and keep only individual sales above $100.
- Aggregation: The filter will be based on the aggregation specified (for example, Sum, Average, Minimum, Maximum, Standard deviation, and Variance) and the aggregation will be performed at the level of detail of the view. For example, a filter keeping only the sum of sales above $100,000 on a view at the level of category will keep only categories that had at least $100,000 in total sales.
Once you've made a selection (or if the selection wasn't applicable for the field selected), you will be given another interface for setting the actual filter, as follows:
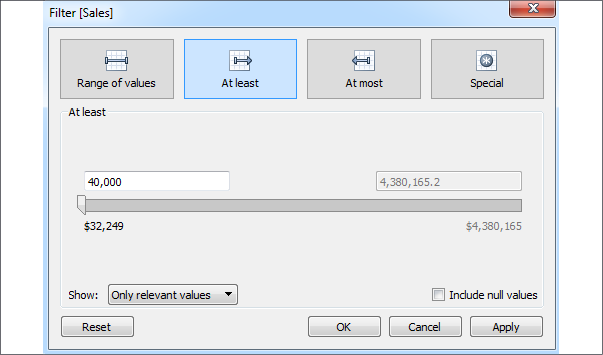
Figure 2.28: Filter options for Sales (as a SUM)
Here, you'll see options for filtering continuous values based on a range with a start, end, or both. The Special tab gives options for showing all values, NULL values, or non-NULL values.
From a user-interface perspective, the most dramatic difference in filtering options comes from whether a field is discrete or continuous. However, you should always think about whether you are using the field as a Dimension Filter or a Measure Filter to understand what kind of results you will get based on the order of operations, which is discussed in the Appendix.
- Dimension filters will filter detail rows of data. For example, filtering out the Central Region will eliminate all rows for that region. You will not see any states for that region and your aggregate results, such as
SUM(Sales), will not include any values from that region. - Measure filters will filter aggregate rows of data at the level of detail defined by the dimensions included in your view. For example, if you filtered to include only where
SUM(Sales)was greater than $100,000 and your view includedRegionandMonth, then the resulting view would include only values where theRegionhad more than $100,000 in sales for the given month.
Other than filtering discrete and continuous fields, you'll also notice some different options for filtering dates, which we'll consider next.
Filtering dates
We'll take a look at the special way Tableau handles dates in the Visualizing dates and times section of Chapter 3, Moving Beyond Basic Visualizations. For now, consider the options available when you drop an Order Date field onto the Filters shelf, as follows:
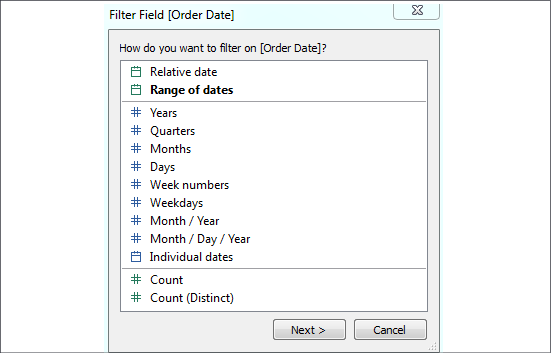
Figure 2.29: Initial filter options for a date field
The options here include the following:
- Relative date: This option allows you to filter a date based on a specific date (for example, keeping the last three weeks from today, or the last six months from January 1).
- Range of dates: This option allows you to filter a date based on a range with a starting date, ending date, or both.
- Date Part: This option allows you to filter based on discrete parts of dates, such as Years, Months, Days, or combinations of parts, such as Month/Year. Based on your selection, you will have various options for filtering and have the option of defaulting to the latest value in the data.
- Individual dates: This option allows you to filter based on each individual value of the date field in the data.
- Count or Count (Distinct): This option allows you to filter based on the count, or distinct count, of date values in the data.
Depending on your selection, you will be given additional options for filtering.
Other filtering options
You will also want to be aware of the following options when it comes to filtering:
- You may display a filter control for nearly any field by right-clicking it and selecting Show Filter. The type of control depends on the type of field, whether it is discrete or continuous, and may be customized by using the little drop-down arrow at the upper-right of the filter control.
- Filters may be added to the context. Context is described in detail in the Appendix and we'll see why it's important in various examples throughout the book. For now, just note the option. This option is available via the drop-down menu on the filter control or the field on the Filters shelf.
- Filters may be set to show all values in the database, all values in the context, all values in a hierarchy, or only values that are relevant based on other filters. These options are available via the drop-down menu on the Filter control or the field on the Filters shelf.
- When using Tableau Server, you may define user filters that allow you to provide row-level security by filtering based on user credentials.
- By default, any field placed on the Filters shelf defines a filter that is specific to the current view. However, you may specify the scope by using the menu for the field on the Filters shelf. Select Apply to and choose one of the following options:
- All related data sources: All data sources will be filtered by the value(s) specified. The relationships of fields are the same as blending (that is, the default by name and type match, or customized through the Data | Edit Relationships... menu option). All views using any of the related data sources will be affected by the filter. This option is sometimes referred to as cross-data source filtering.
- Current data source: The data source for that field will be filtered. Any views using that data source will be affected by the filter.
- Selected worksheets: Any worksheets selected that use the data source of the field will be affected by the filter.
- Current worksheet: Only the current view will be affected by the filter.
We'll see plenty of practical examples of filtering data throughout the book, many of which will make use of some of these options.