Search icon
Subscription
0
Cart icon
Close icon
You have no products in your basket yet
Save more on your purchases!
Savings automatically calculated. No voucher code required
Arrow left icon
All Products
Best Sellers
New Releases
Books
Videos
Audiobooks
Learning Hub
Newsletters
Free Learning
Arrow right icon
Learning Tableau 2020 - Fourth Edition

You're reading from  Learning Tableau 2020 - Fourth Edition

Product type Book
Published in Aug 2020
Publisher Packt
ISBN-13 9781800200364
Pages 576 pages
Edition 4th Edition
Languages
Author (1):
Joshua N. Milligan Joshua N. Milligan
Profile icon Joshua N. Milligan

Table of Contents (19) Chapters

Preface 1. Taking Off with Tableau 2. Connecting to Data in Tableau 3. Moving Beyond Basic Visualizations 4. Starting an Adventure with Calculations and Parameters 5. Leveraging Level of Detail Calculations 6. Diving Deep with Table Calculations 7. Making Visualizations That Look Great and Work Well 8. Telling a Data Story with Dashboards 9. Visual Analytics – Trends, Clustering, Distributions, and Forecasting 10. Advanced Visualizations 11. Dynamic Dashboards 12. Exploring Mapping and Advanced Geospatial Features 13. Understanding the Tableau Data Model, Joins, and Blends 14. Structuring Messy Data to Work Well in Tableau 15. Taming Data with Tableau Prep 16. Sharing Your Data Story 17. Other Books You May Enjoy
18. Index

Quick table calculations

Quick table calculations are predefined table calculations that can be applied to fields used as measures in the view. These calculations include common and useful calculations such as Running Total, Difference, Percent Difference, Percent of Total, Rank, Percentile, Moving Average, YTD Total (year-to-date total), Compound Growth Rate, Year over Year Growth, and YTD Growth. You'll find applicable options on the drop-down list on a field used as a measure in the view, as shown in the following screenshot:

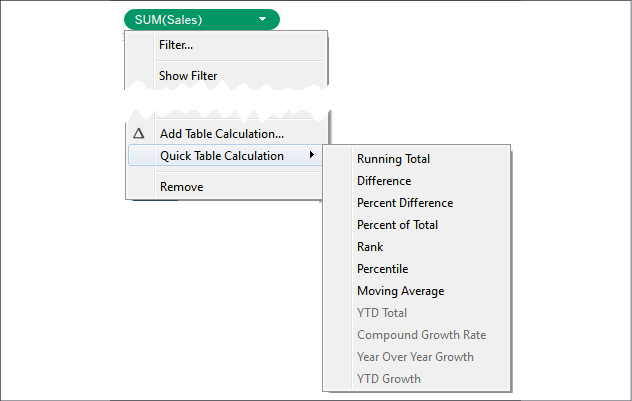
Figure 6.4: Using the dropdown, you can create a quick table calculation from an aggregate field in the view

Consider the following example using the sample Superstore Sales data:

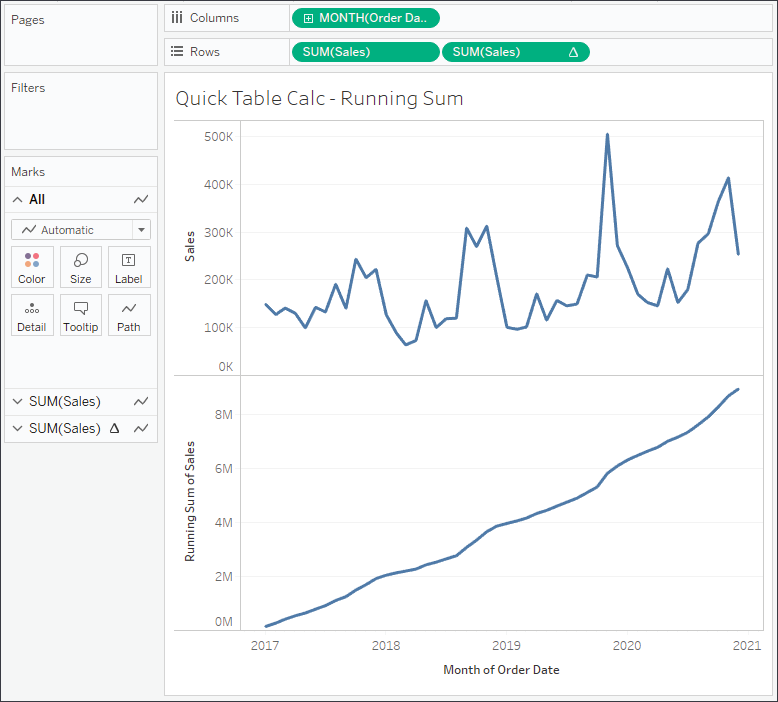
Figure 6.5: The first SUM(Sales) field is a normal aggregate. The second has a quick table calculation of Running Total applied

Here, Sales over time is shown. Sales has been placed on the Rows shelf twice and the second SUM(Sales) field has had...

lock icon The rest of the chapter is locked
Register for a free Packt account to unlock a world of extra content!
A free Packt account unlocks extra newsletters, articles, discounted offers, and much more. Start advancing your knowledge today.
Unlock this book and the full library FREE for 7 days
Get unlimited access to 7000+ expert-authored eBooks and videos courses covering every tech area you can think of
Renews at $15.99/month. Cancel anytime}