Reader small image

You're reading from  Jupyter for Data Science

Product typeBook
Published inOct 2017
Reading LevelBeginner
PublisherPackt
ISBN-139781785880070
Edition1st Edition
Languages
Tools
Right arrow
Author (1)
Dan Toomey
Dan Toomey
author image
Dan Toomey

Dan Toomey has been developing application software for over 20 years. He has worked in a variety of industries and companies, in roles from sole contributor to VP/CTO-level. For the last few years, he has been contracting for companies in the eastern Massachusetts area. Dan has been contracting under Dan Toomey Software Corp. Dan has also written R for Data Science, Jupyter for Data Sciences, and the Jupyter Cookbook, all with Packt.
Read more about Dan Toomey

Right arrow

Chapter 4. Data Mining and SQL Queries

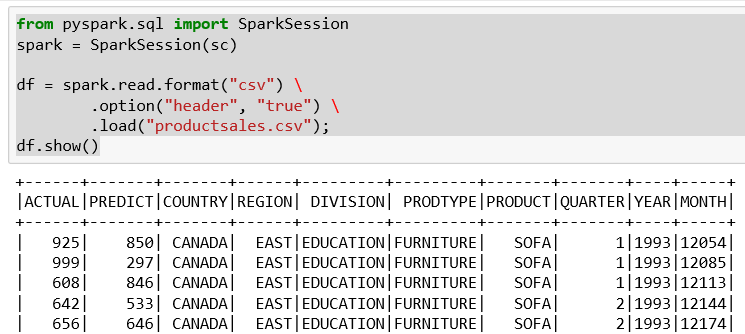
PySpark exposes the Spark programming model to Python. Spark is a fast, general engine for large-scale data processing. We can use Python under Jupyter. So, we can use Spark in Jupyter.

Installing Spark requires the following components to be installed on your machine:

Then set environment variables that show the position of the preceding components:

  • JAVA_HOME: The bin directory where you installed JDK
  • PYTHONPATH: Directory where Python was installed
  • HADOOP_HOME: Directory...

Special note for Windows installation


Spark (really Hadoop) needs a temporary storage location for its working set of data. Under Windows this defaults to the \tmp\hive location. If the directory does not exist when Spark/Hadoop starts it will create it. Unfortunately, under Windows, the installation does not have the correct tools built-in to set the access privileges to the directory.

You should be able to run chmod under winutils to set the access privileges for the hive directory. However, I have found that the chmod function does not work correctly.

A better idea has been to create the tmp\hive directory yourself in admin mode. And then grant full privileges to the hive directory to all users, again in admin mode.

Without this change, Hadoop fails right away. When you start pyspark, the output (including any errors) are displayed in the command line window. One of the errors will be insufficient access to this directory.

Using Spark to analyze data


The first thing to do in order to access Spark is to create a SparkContext. The SparkContext initializes all of Spark and sets up any access that may be needed to Hadoop, if you are using that as well.

The initial object used to be a SQLContext, but that has been deprecated recently in favor of SparkContext, which is more open-ended.

We could use a simple example to just read through a text file as follows:

from pyspark import SparkContextsc = SparkContext.getOrCreate()lines = sc.textFile("B05238_04 Spark Total Line Lengths.ipynb")lineLengths = lines.map(lambda s: len(s))totalLength = lineLengths.reduce(lambda a, b: a + b)print(totalLength)

In this example:

  • We obtain a SparkContext
  • With the context, read in a file (the Jupyter file for this example)
  • We use a Hadoop map function to split up the text file into different lines and gather the lengths
  • We use a Hadoop reduce function to calculate the length of all the lines
  • We display our results

Under Jupyter this looks like...

Another MapReduce example


We can use MapReduce in another example where we get the word counts from a file. A standard problem, but we use MapReduce to do most of the heavy lifting. We can use the source code for this example. We can use a script similar to this to count the word occurrences in a file:

import pysparkif not 'sc' in globals():    sc = pyspark.SparkContext()text_file = sc.textFile("Spark File Words.ipynb")counts = text_file.flatMap(lambda line: line.split(" ")) \             .map(lambda word: (word, 1)) \             .reduceByKey(lambda a, b: a + b)for x in counts.collect():    print x

Note

We have the same preamble to the coding.

Then we load the text file into memory.

Note

text_file is a Spark RDD (Resilient Distributed Dataset), not a data frame.

It is assumed to be massive and the contents distributed over many handlers.

Once the file is loaded we split each line into words, and then use a lambda function to tick off each occurrence of a word. The code is truly creating a new record...

Using SparkSession and SQL


Spark exposes many SQL-like actions that can be taken upon a data frame. For example, we could load a data frame with product sales information in a CSV file:

from pyspark.sql import SparkSession spark = SparkSession(sc) df = spark.read.format("csv") \        .option("header", "true") \        .load("productsales.csv");df.show()

The example:

  • Starts a SparkSession (needed for most data access)
  • Uses the session to read a CSV formatted file, that contains a header record
  • Displays initial rows

We have a few interesting columns in the sales data:

  • Actual sales for the products by division
  • Predicted sales for the products by division

If this were a bigger file, we could use SQL to determine the extent of the product list. Then the following is the Spark SQL to determine the product list:

df.groupBy("PRODUCT").count().show()

The data frame groupBy function works very similar to the SQL Group By clause. Group By collects the items in the dataset according to the values in the column...

Combining datasets


So, we have seen moving a data frame into Spark for analysis. This appears to be very close to SQL tables. Under SQL it is standard practice not to reproduce items in different tables. For example, a product table might have the price and an order table would just reference the product table by product identifier, so as not to duplicate data. So, then another SQL practice is to join or combine the tables to come up with the full set of information needed. Keeping with the order analogy, we combine all of the tables involved as each table has pieces of data that are needed for the order to be complete.

How difficult would it be to create a set of tables and join them using Spark? We will use example tables of Product, Order, and ProductOrder:

Table

Columns

Product

Product ID,

Description,

Price

Order

Order ID,

Order Date

ProductOrder

Order ID,

Product ID,

Quantity


So, an Order has a list of Product/Quantity values associated.

We can populate the data frames and move them into Spark:

from...

Loading JSON into Spark


Spark can also access JSON data for manipulation. Here we have an example that:

  • Loads a JSON file into a Spark data frame
  • Examines the contents of the data frame and displays the apparent schema
  • Like the other preceding data frames, moves the data frame into the context for direct access by the Spark session
  • Shows an example of accessing the data frame in the Spark context

The listing is as follows:

Our standard includes for Spark:

from pyspark import SparkContextfrom pyspark.sql import SparkSession sc = SparkContext.getOrCreate()spark = SparkSession(sc)

Read in the JSON and display what we found:

#using some data from file from https://gist.github.com/marktyers/678711152b8dd33f6346df = spark.read.json("people.json")df.show()

I had a difficult time getting a standard JSON to load into Spark. Spark appears to expect one record of data per list of the JSON file versus most JSON I have seen pretty much formats the record layouts with indentation and the like.

Note

Notice the use...

Using Spark pivot


The pivot() function allows you to translate rows into columns while performing aggregation on some of the columns. If you think about it you are physically adjusting the axes of a table about a pivot point.

I thought of an easy example to show how this all works. I think it is one of those features that once you see it in action you realize the number of areas that you could apply it.

In our example, we have some raw price points for stocks and we want to convert that table about a pivot to produce average prices per year per stock.

The code in our example is:

from pyspark import SparkContextfrom pyspark.sql import SparkSessionfrom pyspark.sql import functions as funcsc = SparkContext.getOrCreate()spark = SparkSession(sc)# load product setpivotDF = spark.read.format("csv") \        .option("header", "true") \        .load("pivot.csv");pivotDF.show()pivotDF.createOrReplaceTempView("pivot")# pivot data per the year to get average prices per stock per yearpivotDF \    .groupBy...

Summary


In this chapter, we got familiar with obtaining a SparkContext. We saw examples of using Hadoop MapReduce. We used SQL with Spark data. We combined data frames and operated on the resulting set. We imported JSON data and manipulated it with Spark. Lastly, we looked at using a pivot to gather information about a data frame.

In the next chapter, we will look at using R programming under Jupyter.


lock icon
The rest of the chapter is locked
You have been reading a chapter from
Jupyter for Data Science
Published in: Oct 2017Publisher: PacktISBN-13: 9781785880070
Register for a free Packt account to unlock a world of extra content!
A free Packt account unlocks extra newsletters, articles, discounted offers, and much more. Start advancing your knowledge today.
undefined
Unlock this book and the full library FREE for 7 days
Get unlimited access to 7000+ expert-authored eBooks and videos courses covering every tech area you can think of
Renews at $15.99/month. Cancel anytime

Author (1)

author image
Dan Toomey

Dan Toomey has been developing application software for over 20 years. He has worked in a variety of industries and companies, in roles from sole contributor to VP/CTO-level. For the last few years, he has been contracting for companies in the eastern Massachusetts area. Dan has been contracting under Dan Toomey Software Corp. Dan has also written R for Data Science, Jupyter for Data Sciences, and the Jupyter Cookbook, all with Packt.
Read more about Dan Toomey