
The Jupyter project has the specific objective of supplying a mechanism to reduce the gap between a user and their data. In this chapter, we will describe the wide range of possibilities of widgets in Jupyter. With these, we can include information for the user in a very good mood to show reporting of data in the same Jupiter tool. You will now make an interface like a human machine process; this will help you understand the basics of having programming software.
Widgets are input devices that can be displayed in a Jupyter Notebook. The Notebook author controls the interaction with the input control and adjusts the Notebook display accordingly. By using widgets, the user has an input device or control that can be used to directly adjust data.
A widget can be of many types:
- Slider—the user is provided a control that can slide from one value to another
- Progress bar
- Input field for text and numeric values
- Toggle switch
- Checkbox
- Drop-down selection list
- Radio button
- Date picker
- Color picker
- A range of display-only devices, such as a valid data marker
- Adjustments to the Notebook, such as adding tabs to the display
- A catch-all, where you can produce your own custom widget
All input controls, where the user is typing or clicking, have a mechanism to provide feedback to the Notebook as to what action the user took; for example, if the user clicked on a button, a handler would be called in the Notebook. A handler is a language-specific set of code that...
ipyleaflet is described as a bridge for producing interactive maps in a Jupyter Notebook. This means we can put a map into a Notebook and allow the user to scroll around to a different point of view with this widget.
The documentation on the maps used is sparse. I have found a reasonable example in the following points. Finally, looking at the source code for the widget on GitHub, there are a few dozen maps visible that the widget knows about and which can be pulled in.
We can install the widget using a conda command:
conda install -c conda-forge ipyleafletipyleaflets can be installed with pip as well.
Once completed, we can reference ipyleaflet in a Notebook.
We are using a detailed worldwide street map from Esri. The Notebook statements are:
from ipyleaflet import *
m = Map(zoom=4, basemap=basemaps.Esri.WorldStreetMap)
m
m.zoom
This generates the first image of the west coast of Africa. I navigated to the streets of Boston for the shot.
ipywidgets is a set of widgets produced as part of the Jupyter project. As such, I would expect their use and number to increase with the project's popularity.
ipywidgets can also be installed with conda using:
conda install -c conda-forge ipywidgetsThere are pip install commands available as well.
Using an
ipywidget
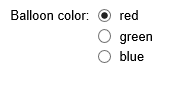
I picked the radio button widget as an example.
We can use this code:
import ipywidgets as widgets

widgets.RadioButtons(
 options=['red', 'green', 'blue'],
 description='Balloon color:',
 disabled=False
)
This displays as:
All of the individual widgets work the same:
- Import the reference of the widget type you want to use
- Instantiate the widget using its parameters
- Optionally add handling to take a new value from the widget
In this example, we are using the Python convention of importing the entire library and calling it widgets. Then we use a specific widget type by referencing it via the dot notation. Each of the widget types...
A container is usually a box that groups controls/widgets together. You can imagine if you had a large form with many widgets; it would make it easier for the user if widgets are grouped into different containers like items.
We can use this script:
from ipywidgets import *
from IPython.display import display

slider = widgets.FloatSlider()
message = widgets.Text(value='Hello World')

container = widgets.Box(children=[slider, message])
container.layout.border = '1px black solid'

display(container)
This results in a display:

The container box instantiates like other widgets. The difference is that we pass in the list of contained widgets in its constructor. Once constructed, we can add different adornments, such as a border. Then, like other graphical elements, we display the container, which automatically draws its contained widgets as well.
interactive is another set of widgets in the ipywidget library. They are specifically built to expect to call upon a handler when the value changes.
We can use this script:
def mycheckfunction(x):
    print(x)
    return x

interactive_checkbox = interactive(mycheckfunction, x=False)
interactive_checkbox
This results in this display:
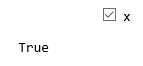
Here, as we click on the checkbox, the value of the box changes and the corresponding value is printed in the display.
The constructor for the interactive widget has the first argument as the name of the handler to use when the value changes. The second argument is the default value. In this case, we have a checkbox, so the value is False. It could be True as well.
When you click on the box the value changes, triggering a call to the handler. The handler prints out the current value of the box.

We saw individual widget use earlier. We will now link widgets in the following examples.
We can link together two widgets using code like this:
import ipywidgets as widgets

floatTextBox = widgets.FloatText()
floatSlider = widgets.FloatSlider()
display(floatTextBox,floatSlider)

widgetLink = widgets.jslink((floatTextBox, 'value'), (floatSlider, 'value'))
It produces a display of both widgets linked together. If you move the slider, then the textbox value will be updated and vice versa:
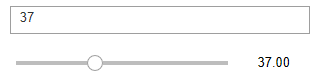
We can link two widgets together using a call to widgets.jslink. Whenever one widget changes (in an attribute such as value), we can have another widget take that new value for itself and re-display it.
The key to this feature is the js in the method signature. Under the hood, we are using javascript event processing based on changes to the value of the objects. Of course, the actual display of the text value and moving the slider control is part of ipywidgets...
We can link one of the controls to a graphic display, which I think is much more interesting.
We can use the following code:
%matplotlib inline
from ipywidgets import interactive
import matplotlib.pyplot as plt
import numpy as np

def f(r):
 plt.axes()
 circle = plt.Circle((0, 0), radius=r, fc='y')
 plt.gca().add_patch(circle)
 plt.axis('scaled')
 plt.show()

interactive_plot = interactive(f, r=(0.0, 1.0))
output = interactive_plot.children[-1]
output.layout.height = '350px'
interactive_plot
The display looks like is:
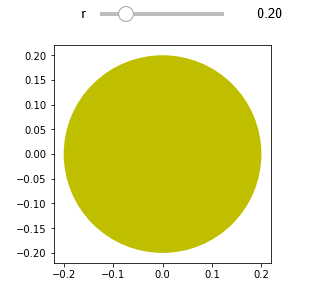
Changing the position of the slide bar changes the value of the slide bar. The new value of the slide bar is used to repaint the circle image using the slide bar value as the radius of the circle.
Just as we saw in the previous linking example, the underlying code is attaching an event listener (the f function we defined just now) to the slide bar. When the value of the slide bar changes, it calls upon the event handler...
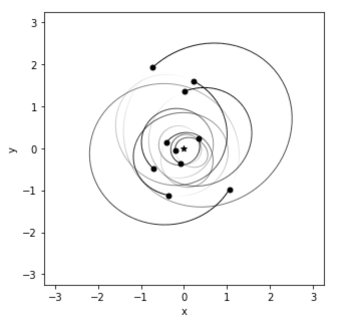
A section of OPENGL, Rebound/WebGL, is available as a widget. Rebound can be used to portray objects in orbit under the effects of gravity.
Not the typical statistical subject, but it's useful in determining solutions in an area that has vast amounts of data to be analyzed. And more importantly, it shows how far you can go with a widget.

The simulation scenario allows for easily adding more objects with varied orbit patterns.
We can use a script like this:
import rebound

# setup simulation
sim = rebound.Simulation()
sim.getWidget()

# add star
sim.add(m=1)

# add ten 'planets'
for i in range(10):
 sim.add(m=1e-3, a=0.4+0.1*i, inc=0.03*i, omega=5.*i)

# center all particles
sim.move_to_com()

# advance the simulation
sim.integrate(500)

# get our final display on screen
fig = rebound.OrbitPlot(sim)
fig
This results in a display like: