

The search app is where most actions in Splunk start.
If you want to follow the examples that appear in the next few chapters, install the ImplementingSplunkDataGenerator demo app by following these steps:
Download ImplementingSplunkDataGenerator.tar.gz from the code bundle available on the site http://www.packtpub.com/support.
Choose Manage apps… from the Apps menu.
Click on the button labeled Install app from file.
Click on Choose File, select the file, and then click on Upload.
This data generator app will produce about 16 megabytes of output per day. The app can be disabled so that it stops producing data by using Manage apps…, under the App menu.
The user is initially presented with the Summary view, which contains information about what data that user searches by default. This is an important distinction—in a mature Splunk installation, not all users will always search all data by default.
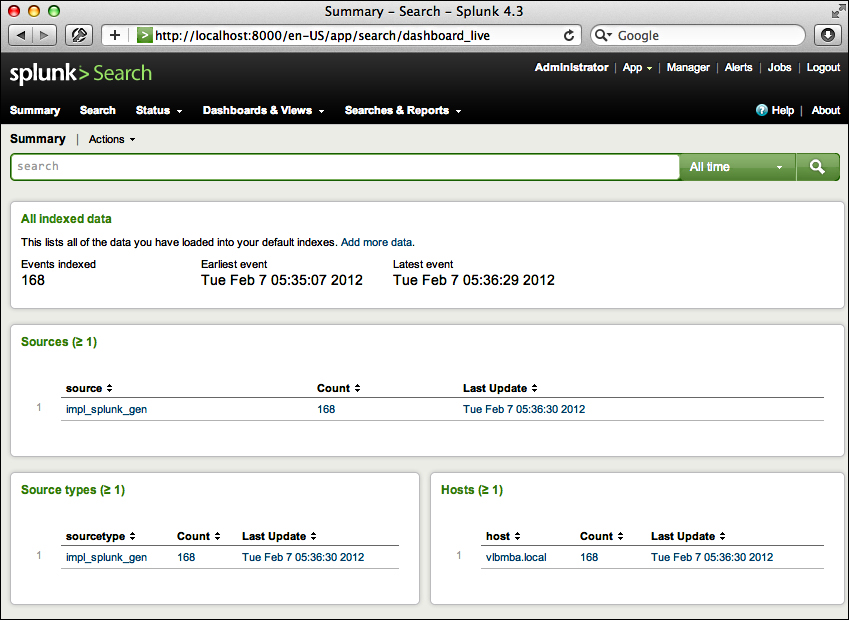
Let's start below the app name and discuss all the new widgets. The first widget is the navigation bar.

On most pages we encounter from now on, you will see this navigation bar. Items with downward triangles are menus. Items without a downward triangle are links. We will cover customizing the navigation bar in Chapter 7, Working with Apps.
Next we find the search bar. This is where the magic starts. We'll go into great detail shortly.

The All indexed data panel shows statistics for all indexed data. Remember that this only reflects indexes that this particular user searches by default. There are other events that are indexed by Splunk, including events Splunk indexes about itself. We will discuss indexes in Chapter 9, Building Advanced Dashboards.
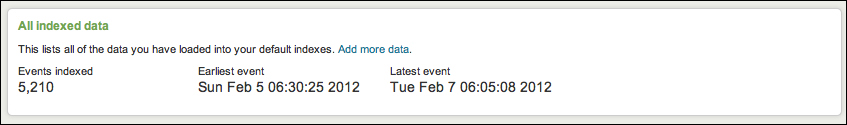
The next three panels give a breakdown of your data using three important pieces of metadata—source, sourcetype, and host.
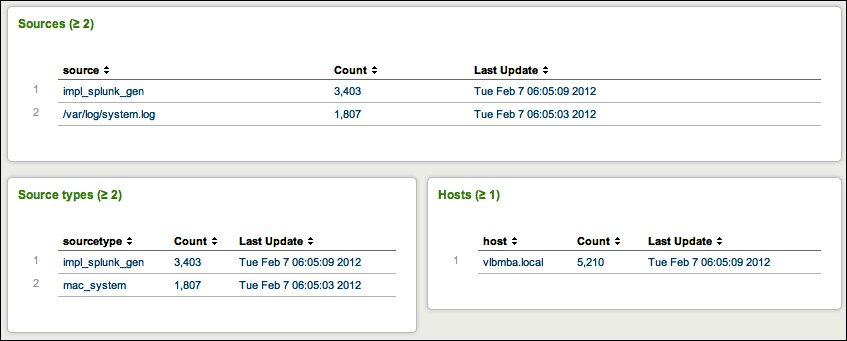
A source in Splunk is a unique path or name. In a large installation, there may be thousands of machines submitting data, but all data at the same path across these machines counts as one source. When the data source is not a file, the value of the source can be arbitrary, for instance the name of a script or network port.
A source type
is an arbitrary categorization of events. There may be many sources across many hosts in the same source type. For instance, given the sources /var/log/access.2012-03-01.log and /var/log/access.2012-03-02.log on the hosts fred and wilma, you could reference all of these logs with source type access or any other name you like.
A host is a captured hostname for an event. In majority of the cases, the host field is set to the name of the machine where the data originated. There are cases where this is not known, so the host can also be configured arbitrarily.
We've finally made it to search. This is where the real power of Splunk lies.
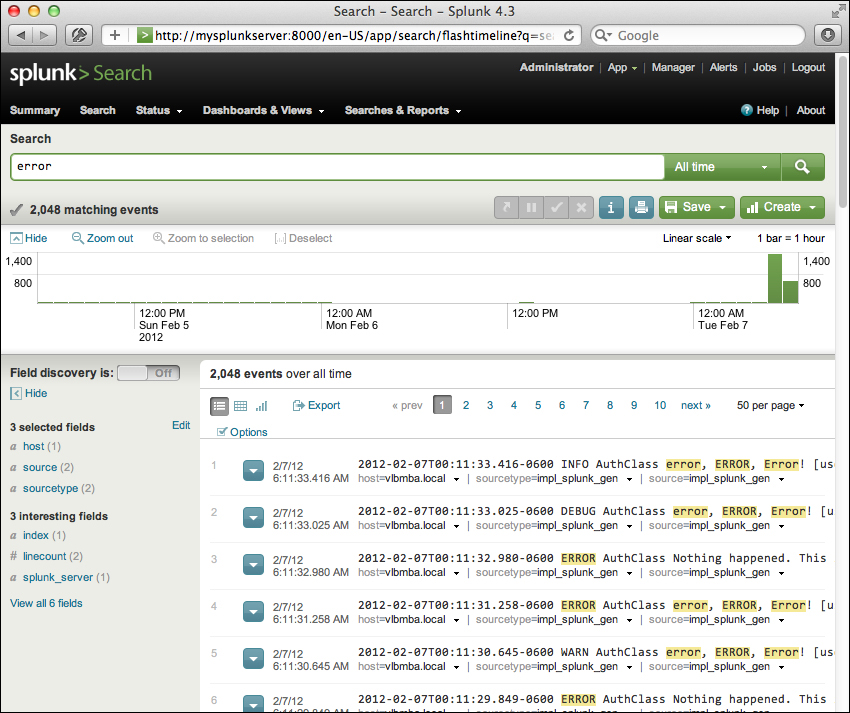
For our first search, we will search for the word error. Click in the search bar, type the word error, and then either press Enter or click on the magnifying glass on the right of the bar.

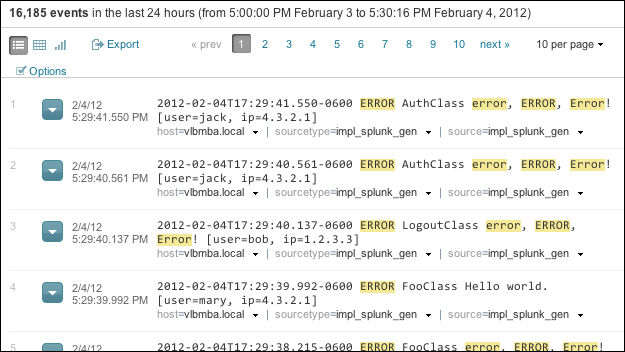
Upon initiating the search, we are taken to the search results page.
Note
Note that the URL in the browser has changed to flashtimeline. You may see references to flashtimeline from time to time. It is simply another name for the search interface.
See the Using the time picker section for details on changing the time frame of your search.
Let's inspect the elements on this page. Below the search bar itself, we have the event count, actions icons, and menus.

Starting at the left, we have:
The number of events matched by the base search. Technically, this may not be the number of results pulled from disk, depending on your search. Also, if your query uses commands, this number may not match what is shown in the event listing.
Send to background (
 ), which sends the currently running search to the background, where it will continue to run. Jobs sent to the background and past jobs can be restored from the Jobs window.
Pause (
 ), which causes the current search to stop locating events but keeps the job open. This is useful if you want to inspect the current results to determine whether you want to continue a long running search.
Finalize (
 ), which stops the execution of the current search but keeps the results generated so far. This is useful when you have found enough and want to inspect or share the results found so far.
Cancel (
 ), which stops the execution of the current search and immediately deletes the results.
Job Inspector (
 ), which opens the Search job inspector window, which provides very detailed information about the query that was run.
Print (
 ), which formats the page for printing and instructs the browser to print.
Save, which provides different options for saving the search or the results. We will discuss this later in this chapter.
Create, which provides wizard-like interfaces for building different objects from this search. We will discuss these options in Chapter 4, Simple XML Dashboards.
Below the actions icons, we have the timeline.
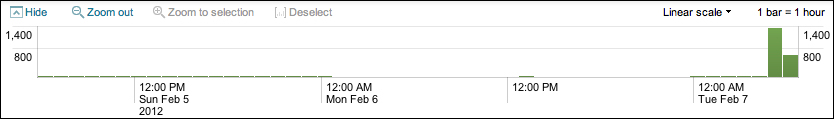
Along with providing a quick overview of the event distribution over a period of time, the timeline is also a very useful tool for selecting sections of time. Placing the pointer over the timeline displays a pop up for the number of events in that slice of time. Clicking on the timeline selects the events for a particular slice of time.
Clicking and dragging selects a range of time.
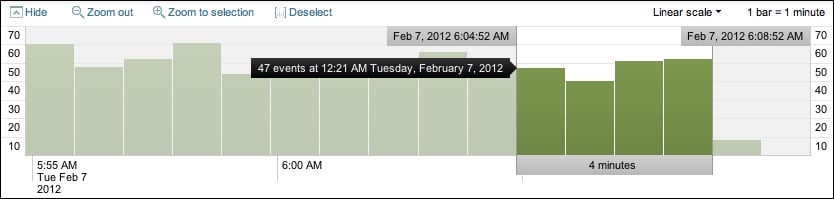
Once you have selected a period of time, clicking on Zoom to selection changes the time frame and re-runs the search for that specific slice of time. Repeating this process is an effective way to drill down to specific events.
Deselect shows all events for the time range selected in the time picker.
Zoom out changes the timeframe to a larger timeframe around the events in the current timeframe.
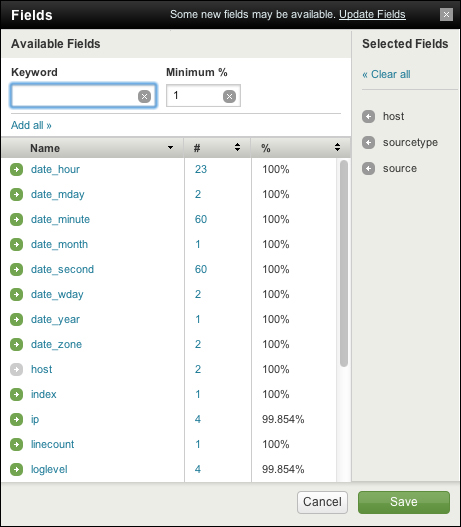
To the left of the search results, we find the field picker. This is a great tool for discovering patterns and filtering search results.
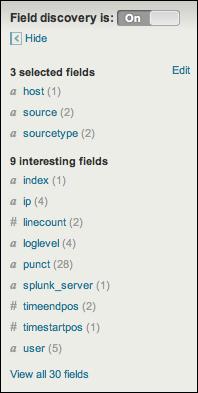
The fields list contains two lists:
Selected fields, which have their values displayed under the search event in the search results
Interesting fields, which are other fields that Splunk has picked out for you
The Edit link next to selected fields and the View all 30 fields link at the bottom of the field picker both take you to the Fields window.
We are almost through all of the widgets on the page. We still have a number of items to cover in the search results section though, just to be thorough.
Starting at the top of this section, we have the number of events displayed. When viewing all results in their raw form, this number will match the number above the timeline. This value can be changed either by making a selection on the timeline or by using other search commands.
Next, we have actions that affect these particular results. Starting at the left we have:
Events List (
 ), which will show the raw events. This is the default view when running a simple search, as we have done so far.
Table (
 ), which shows a table view of the results. This is the default view when any reporting commands are used. When looking at raw events, this view will show a table with the time of the event, any selected fields, and finally the raw event.
Results Chart (
 ), which shows a chart, if the data allows. For simple searches, charts don't make sense, but they are very useful for reporting.
Export, which allows you to export these particular results to CSV, Raw events, XML, or JSON. New to Splunk 4.3 is the ability to export an unlimited number of results from the web interface.

Options presents display options for the event viewer. See the following section for a discussion about these options.
To the right, you can choose a page of results and change the number of events per page.
The items presented in the options pop up deserve a short discussion.
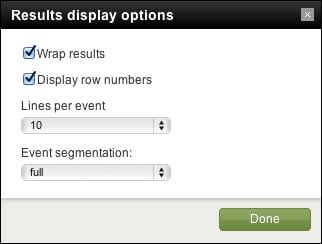
Wrap results controls whether events are wrapped at the right edge of the browser window.
Display row numbers toggles the display of the row number to the left of each event.
Lines per event changes the maximum number of lines of an event displayed in the browser per event. There are a few things to note here:
All lines of the event are indexed and searchable
If the value for this setting is too large, and if a search returns many large messages, your browser may have trouble rendering what it is told to display
Events with many lines will have a link at the bottom to see more lines in the event
The most interesting option here is Event segmentation. This setting changes what text is highlighted as you mouse over events. We will discuss this further in Chapter 2, Understanding Search.
Finally, we make it to the actual events. Let's examine a single event.

Starting at the left, we have:
The event number: Raw search results are always returned in the order "most recent first".
The event options menu (
 ): This menu contains workflow actions, a few of which are always available.
Build Eventtype: Event types are a way to name events that match a certain query. We will dive into event types in Chapter 6, Extending Search.
Extract Fields: This launches an interface for creating custom field extractions. We will cover field extraction in Chapter 3, Tables, Charts, and Fields.
Show Source: This pops up a window with a simulated view of the original source.
Next appear any workflow actions that have been configured. Workflow actions let you create new searches or links to other sites using data from an event. We will discuss workflow actions in Chapter 6, Extending Search.

Next comes the parsed date from this event, displayed in the time zone selected by the user. This is an important and often confusing distinction. In most installations, everything is in one time zone—the servers, the user, and the events. When one of these three things is not in the same time zone as the others, things can get confusing. We will discuss time in great detail in Chapter 2, Understanding Search.
Next, we see the raw event itself. This is what Splunk saw as an event. With no help, Splunk can do a good job finding the date and breaking lines appropriately, but as we will see later, with a little help, event parsing can be more reliable and more efficient.
Below the event are the fields that were selected in the field picker. Clicking on the value adds the field value to the search. Each field value also has a menu:
Tag fieldname=valueallows you to create a tag that can be used for classification of events. We will discuss tags in Chapter 6, Extending Search.Report on field launches a wizard showingv the values of this field over time.
Workflow actions can also appear in these field menus, allowing you to create actions that link to new searches or external sites by using a particular field value.
