Reader small image

You're reading from  Expert Data Visualization

Product typeBook
Published inApr 2017
Reading LevelIntermediate
PublisherPackt
ISBN-139781786463494
Edition1st Edition
Languages
Tools
Right arrow
Author (1)
Jos Dirksen
Jos Dirksen
author image
Jos Dirksen

Jos Dirksen has worked as a software developer and architect for almost two decades. He has a lot of experience in many technologies, ranging from backend technologies, such as Java and Scala, to frontend development using HTML5, CSS, JavaScript, and Typescript. Besides working with these technologies, Jos regularly speaks at conferences and likes to write about new and interesting technologies on his blog. He also likes to experiment with new technologies and see how they can best be used to create beautiful data visualizations. Previously, Jos has worked in many different roles in the private and public sectors, ranging from private companies such as ING, ASML, Malmberg, and Philips to organizations in the public sector, such as the Department of Defense and the Port of Rotterdam.
Read more about Jos Dirksen

Right arrow

Custom Shapes and Paths and Using a Brush Selection

In this chapter, we're going to look at a couple of leftover subjects:

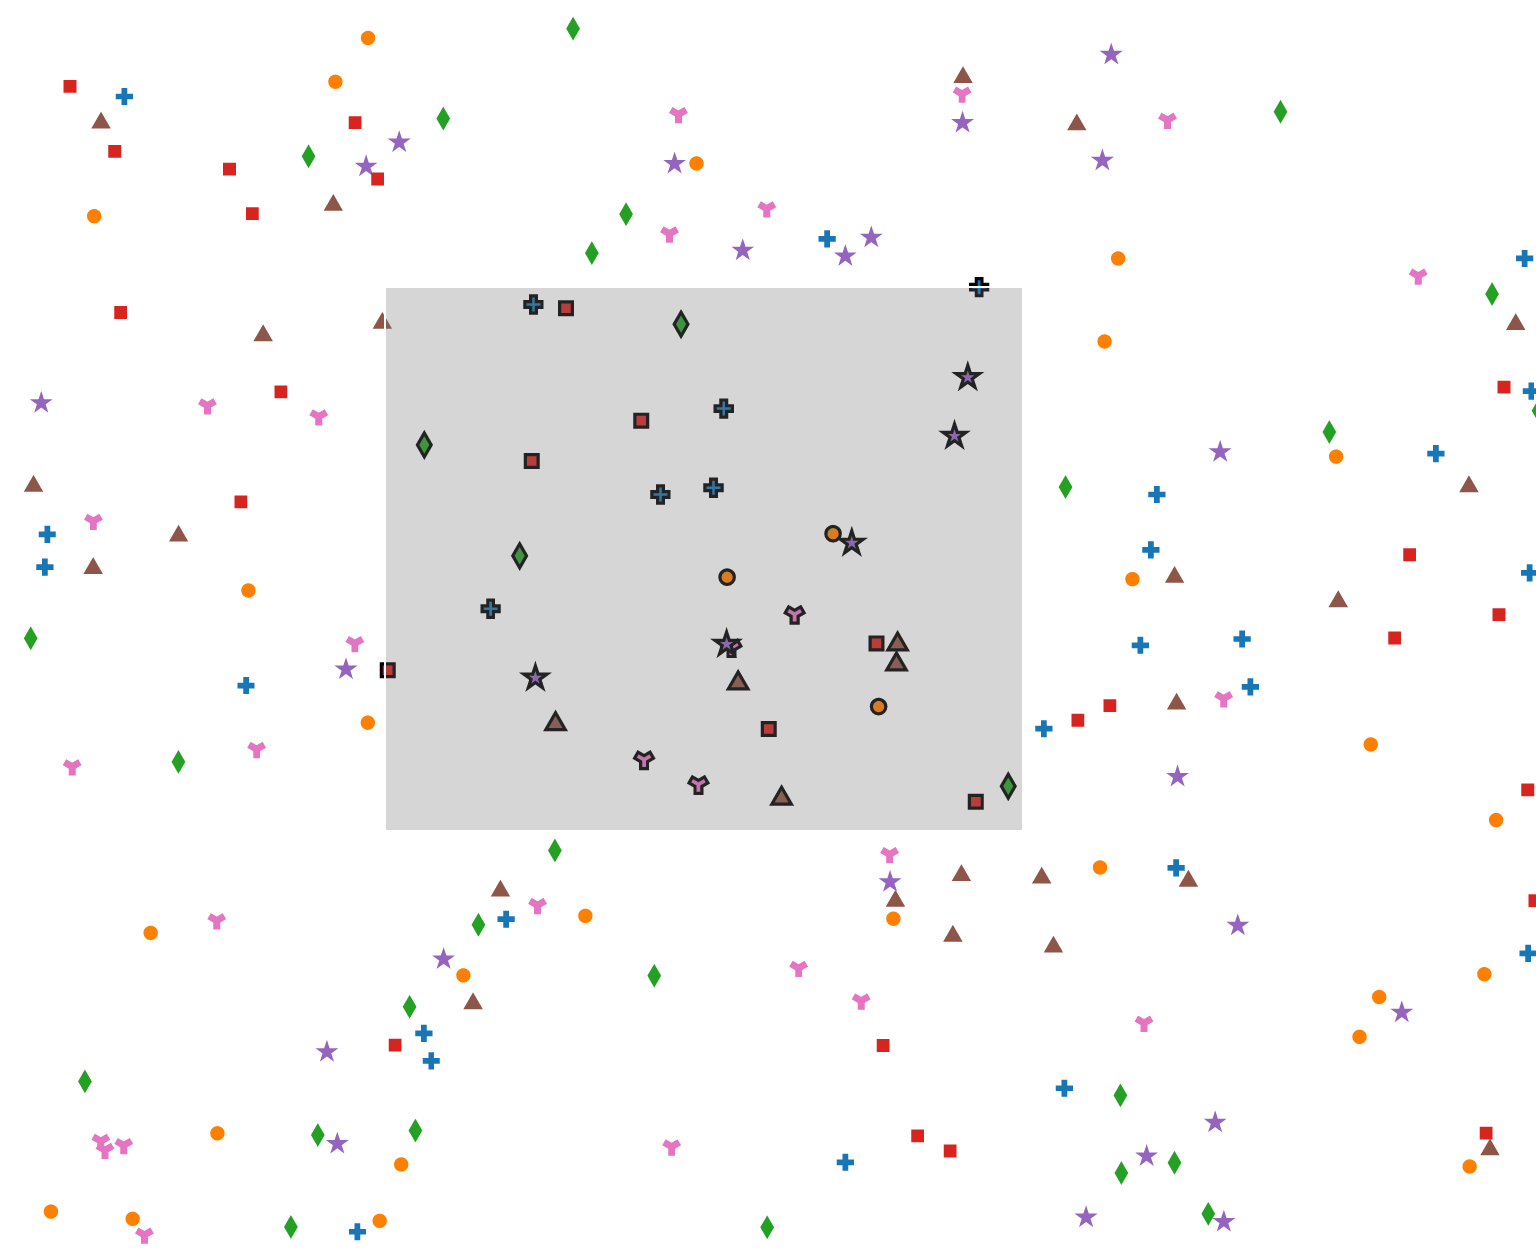
  • Symbols: We start by looking at the different types of symbols that are supported by D3. A symbol is just a small SVG path, which looks like a cross, a diamond, and so on. You can use symbols to better annotate scatterplots or line graphs.
  • Paths: We've already seen paths being used by the different path generators, but we can also construct paths directly. For this example, we'll look at how you can use the d3.path function to create paths from scratch and use them in SVG or on a 2D canvas.
  • Exporting SVG: With D3, you can create beautiful-looking visualizations. However, they can usually only be accessed from a browser with JavaScript support. In this chapter, we'll also show you how you can export your D3 visualization as a PNG and as an SVG file.
  • Importing SVG: In the...

Symbols supported in D3

If you look at the d3.shape API (https://github.com/d3/d3-shape), you can see all the different standard shapes provided by D3, and you'll notice that we've already discussed most of them in the previous chapters. However, there is one part of this API that we haven't explored yet, and that is the symbols.

D3 provides a number of standard symbols that you can use in your visualizations. For instance, when drawing a line chart, instead of drawing circles for each point of the chart, you could use a cross or a star. D3 comes with the following list of standard symbols:

  • d3.symbolCross: A cross symbol, or an addition (+) symbol
  • d3.symbolCircle: A simple circle
  • d3.symbolDiamond: A diamond symbol, as used on playing cards
  • d3.symbolSquare: A simple square
  • d3.symbolStar: A five pointed star
  • d3.symbolTriangle: A simple triangle, point up
  • d3.symbolWye: A Y symbol

Each of these symbols...

Using d3.path to draw paths

In this section, we're going to explore the functions provided by the d3.path function to directly define a path that can be drawn with D3.

Drawing using the path API

Creating paths directly with SVG is rather complex, and it involves writing statements like this:

<path d=" 
M 213.1,6.7
c -32.4-14.4-73.7,0-88.1,30.6
C 110.6,4.9,67.5-9.5,36.9,6.7
C 2.8,22.9-13.4,62.4,13.5,110.9
C 33.3,145.1,67.5,170.3,125,217
c 59.3-46.7,93.5-71.9,111.5-106.1
C 263.4,64.2,247.2,22.9,213.1,6.7
z" />

As we've already seen in earlier chapters, D3 hides most of this complexity behind path generators. Sometimes, though, you might need to create a path generator yourself, or you might want to be able to draw a path yourself...

Exporting visualizations

When we create a visualization and we want to export it, we can use two different approaches. We can export it as a bitmap image (for example, PNG) or we can export it as a vector image (SVG format). In this section, we'll look at both approaches.

Exporting visualizations as PNG

To export an SVG element as a PNG, we need to take a couple of steps. Let's first get one of our visualizations that we want to export. We'll work with one of the geographic examples from Chapter 5, Working with Geo Data (D05-01.html):

To export this map, we'll take the following steps:

  1. Create a separate CSS for the styles we want to apply.
  2. Convert the SVG element to a string.
  3. Use the canvas to get a PNG file.
  4. Save the content from the canvas...

Exporting visualizations as SVG and importing them in an external program

In the previous section, we showed how to export our SVG visualization as an image, but we can, of course, also save the element as an SVG file so it can be imported into external programs, such as Adobe Illustrator, Boxy SVG, or Inkscape.

For exporting SVGs as .svg files, we can use two different approaches. If you use Chrome, there is a Bookmarklet that you can use, and which can be found at http://nytimes.github.io/svg-crowbar/. When you've installed this Bookmarklet, you can export SVG from any page you want. In this section, though, we'll provide an alternative approach that pretty much follows the same steps that we did for exporting SVG as a PNG file:

  1. We'll once again start by defining the specific CSS style that should be included in the exported SVG file.
  2. Then we combine the SVG and the CSS file into a single SVG string...

Importing SVG from Inkscape and use in D3

We've already shown you how to load external SVG files in a couple of the examples from the previous chapters. In this section, we'll give a quick overview of all the steps you need to load an SVG file that we modified ourselves in Inkscape and show it using D3.

For this, we've taken an SVG image of a tiger and used Inkscape to rotate it so that it looks like this:

Now let's look at the minimal code required to import this tiger (DVD3/src/chapter-08/D08-05.html):

d3.xml('data/tiger.svg', loaded); 

function loaded(err, tiger) {
var tigerSVG = d3.select(tiger.documentElement.querySelector("g")).attr("transform", null).node();
svg.append("g").node().appendChild(tigerSVG);
}
};

When we open this example in the browser, we can see our rotated tiger:

Now we can use D3 to modify the SVG.

...

Using brushes to select elements

For this last section in the chapter, we're going to look at how you can easily select an area on an SVG element using a d3.brush. The easiest way to understand what a brush does is by looking at an example. If you open up the example <DVD3>/src/chapter-08/src/D08-06.js in your browser, you're presented with 200 randomly placed symbols. When you use the mouse, you can left-click and select an area. The square you see is a d3.brush:

You can easily resize and move this d3.brush without any customizing using the mouse. For this example, we used d3.brush to select the symbols that fall within the area and highlight them. We'll explain the code to do this in the following sections. The first thing we do, for this example, is create the set of 200 symbols and color them just as we did in the beginning of this chapter:

var symbols = [ 
{name: 'Cross',...

Summary

In this chapter, we've explored a couple of the D3 APIs that we skipped in the previous chapters. We first looked at the different symbols supported by D3 that you can easily use in line charts or scatterplots. Next, we looked at how you can use the d3.path API directly to draw lines and shapes. We also looked at an alternative use of paths, where we use them to define how an animated object moves across the screen. In the second part of this chapter, we focused on how to import and export SVG visualizations. We first showed how to export an SVG element as a PNG and as an SVG. After that, we showed how to load an external SVG file and use it in D3. Finally, we looked at the d3.brush API, which can be used to select multiple elements on the screen.

In the next chapter, which is the last one, we'll explore some of the third-party extensions of D3 and how you can use D3 in ES6 and TypeScript.

...
lock icon
The rest of the chapter is locked
You have been reading a chapter from
Expert Data Visualization
Published in: Apr 2017Publisher: PacktISBN-13: 9781786463494
Register for a free Packt account to unlock a world of extra content!
A free Packt account unlocks extra newsletters, articles, discounted offers, and much more. Start advancing your knowledge today.
undefined
Unlock this book and the full library FREE for 7 days
Get unlimited access to 7000+ expert-authored eBooks and videos courses covering every tech area you can think of
Renews at $15.99/month. Cancel anytime

Author (1)

author image
Jos Dirksen

Jos Dirksen has worked as a software developer and architect for almost two decades. He has a lot of experience in many technologies, ranging from backend technologies, such as Java and Scala, to frontend development using HTML5, CSS, JavaScript, and Typescript. Besides working with these technologies, Jos regularly speaks at conferences and likes to write about new and interesting technologies on his blog. He also likes to experiment with new technologies and see how they can best be used to create beautiful data visualizations. Previously, Jos has worked in many different roles in the private and public sectors, ranging from private companies such as ING, ASML, Malmberg, and Philips to organizations in the public sector, such as the Department of Defense and the Port of Rotterdam.
Read more about Jos Dirksen