


Learning D3 can be a bit overwhelming. There are a large number of APIs to learn, you need to think about styling, animations, and formatting your data in the correct way. To help you with these subjects, this book will use an example-driven approach to show you the various features of D3. Each chapter will have a number of examples in the sources accompanying this book, and in each of the chapters we'll walk through these examples and explain what is happening, and in this way show you what can be done by D3.
Setup of this book
Installing an editor
The easiest way for you to learn D3 is by playing around with the examples, and see what happens when you change part of the code. So when you're reading through this book, looking at the examples it is probably best to do this while sitting at your computer, and running and modifying the examples while you read. Since D3 is just plain old JavaScript and CSS (or SCSS, as we'll explain in a later chapter), all you need to edit the examples from this book is a text editor. However, it is easier to use a text editor that understands JavaScript. If you haven't got a preferred one installed, the following text editors are good for working with JavaScript:
- Sublime: This is one of the most popular editors for editing JavaScript (and other languages for that matter) and it provides builds for all major platforms. Sublime is a commercial product, but provides an evaluation copy you can use for free. You can download Sublime from here: https://www.sublimetext.com.
- Notepad ++: This is a Windows-only editor and a great choice when you're running a MS Windows environment. Notepad++ is an open source editor and can be easily extended with a number of plugins. While Notepad++ doesn't support JavaScript out of the box, it can be easily extended through the use of plugins. Notepad++ can be downloaded from here: https://notepad-plus-plus.org/. A good JavaScript plugin for Notepad++ can be found here: http://www.sunjw.us/jstoolnpp/.
- Atom: A final great cross-platform editor is Atom (from the guys behind GitHub). Atom is an editor that can be easily extended with plugins to provide a very good development environment. Atom is open source, and you can use it without any costs. Atom can be downloaded from here: https://atom.io/. A good plugin that provides additional JavaScript support can be added by installing the language-JavaScript package.
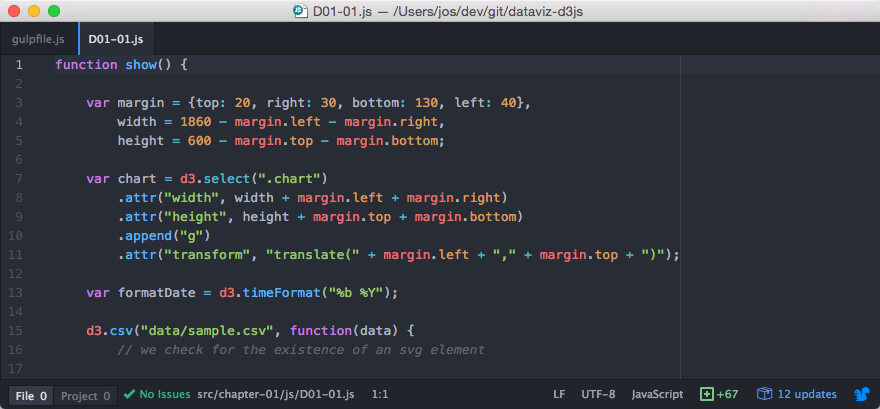
The aforementioned editors have great JavaScript support (or it can be added by using a couple of plugins). The following figure shows how Atom highlights and provides JavaScript support:
Besides editors that support JavaScript, there are also a number of Integrated Development Environments (IDEs) you can use to edit JavaScript. These provide a lot of additional functionality for testing, running, and debugging your code (which we won't touch upon in this book), and also provide a somewhat better JavaScript editing experience. A couple of good IDEs, which have a free or community edition that you can use, are listed as follows:
- WebStorm: This is a great JavaScript IDE (and anything else web related) from IntelliJ. WebStorm is provided in a community edition and a commercial one. For developing JavaScript, the community edition provides all the features that you need. You can get the community edition from here: https://www.jetbrains.com/webstorm/.
- Visual Studio: If you're on a MS Windows system, you might also have a look at the Visual Studio Community edition. It provides JavaScript support out of the box. The Visual Studio Community edition is free to use and can be found here: https://beta.visualstudio.com/vs/community/.
My personal opinion is that if you want to use a simple text editor, you should go for either Sublime or Atom, and if you want to go the IDE way, I'd pick WebStorm.
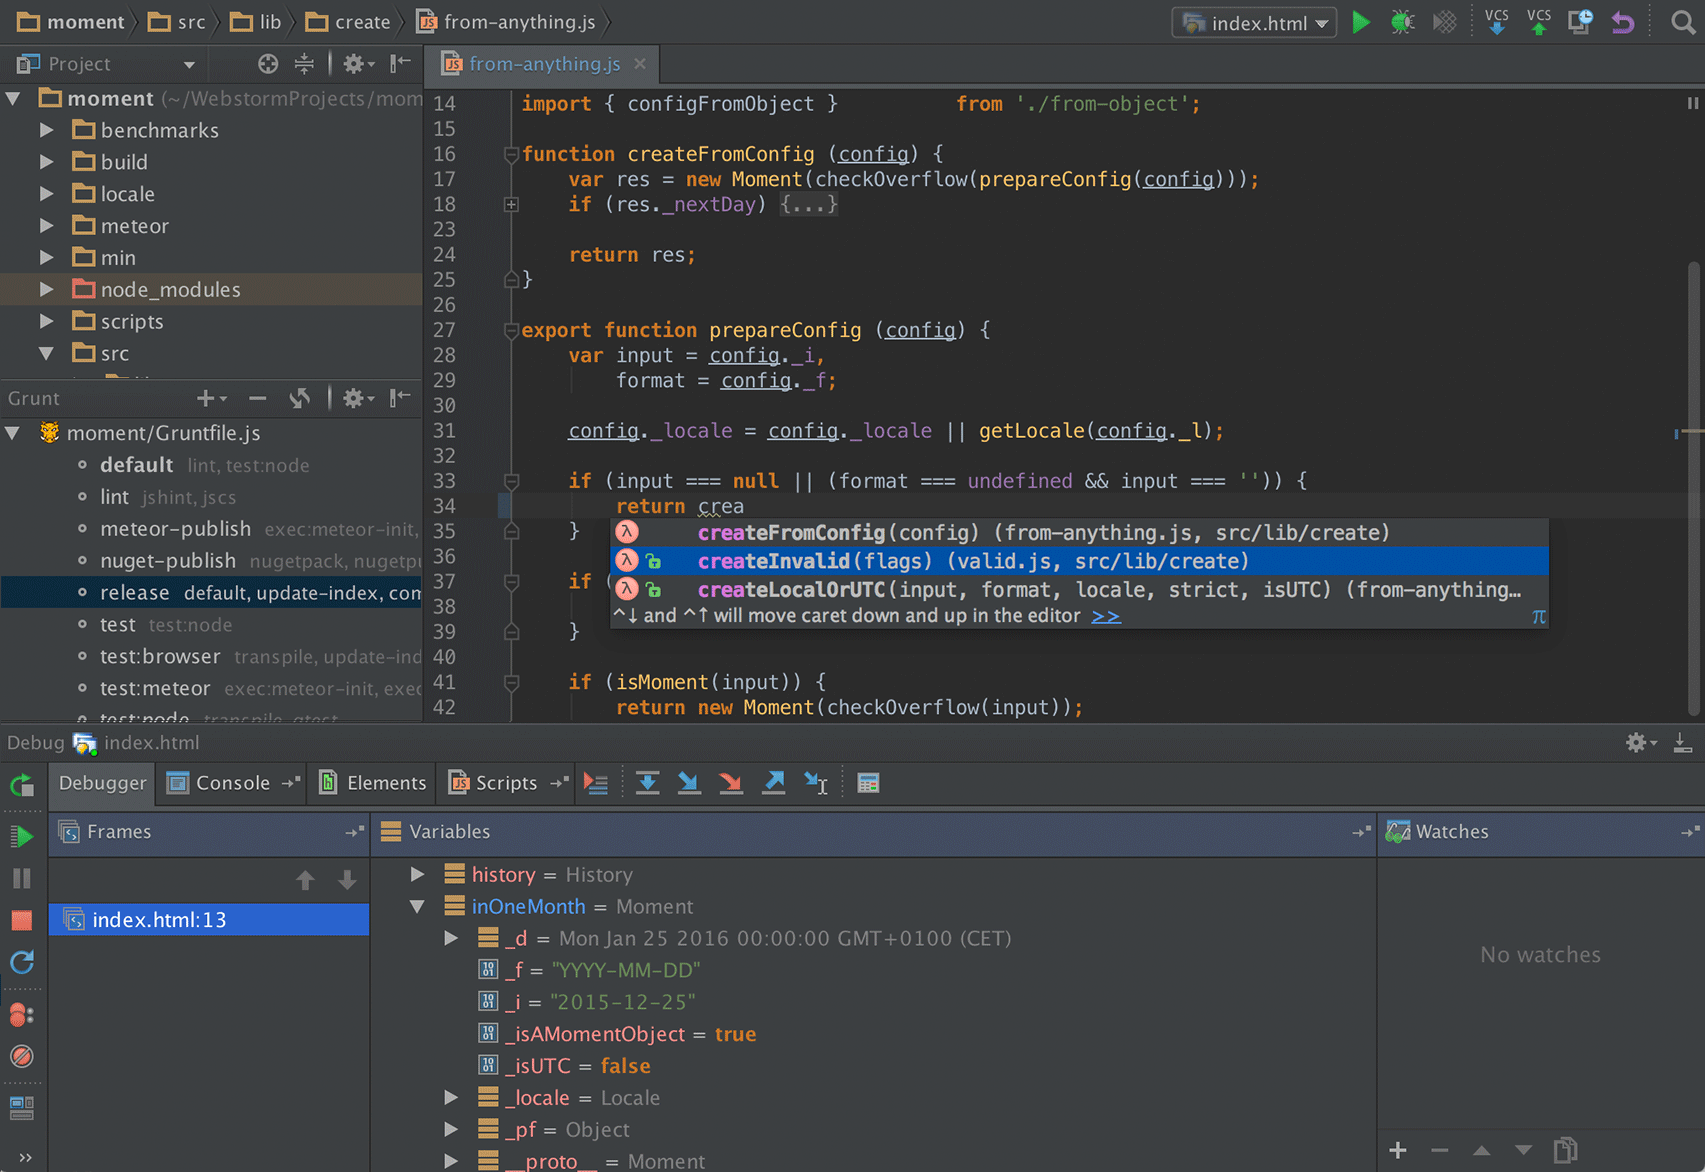
The following screenshot, for example. shows how WebStorm provides code completion for JavaScript:
But, once again, every text editor can be used, since we're just editing standard text files. If you haven't installed an editor yet, now is a good time, since in the next section we'll explain how to get the sources for this book and set up a local web server so you can run the samples.
Getting the sources and setting up a web server
In this section, we'll show you how you can access the sources that are provided together with this book. There are a couple of different ways you can get the sources.
We've got two locations where you can download a zip file with the sources:
- You can download them directly from the Packt Publishing website here: https://www.packtpub.com/books/content/support
- You can alternatively download them from GitHub here: http://github.com/josdirksen/d3dv/archive/master.zip
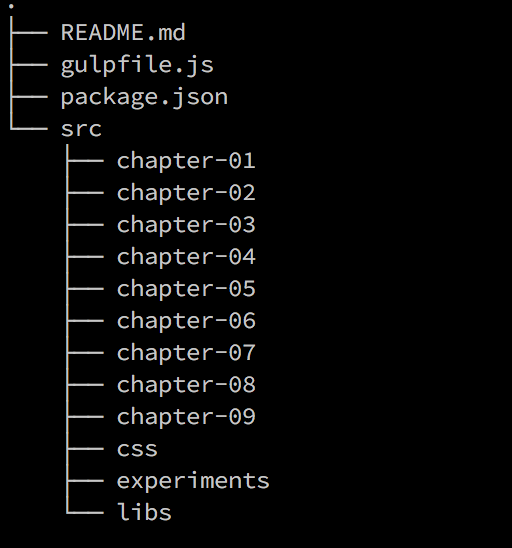
Once you've downloaded these, just unzip them to a location of your choice. This should result in a directory structure which looks something like this:
For the rest of this book, we'll reference the directory where you extracted the sources to <DVD3>. We can then use it to point to specific examples or files like this: <DVD3>/src/chapter-01/D01-D01.js.
All the sources of this book can be found on GitHub in the http://github.com/josdirksen/d3dv.git repository. If you've already got Git installed on your machine, you can of course just clone the repository to get access to all the latest sources:
    > git clone https://github.com/josdirksen/d3dv.git
    Cloning into 'd3dv'...
    remote: Counting objects: 3, done.
    remote: Total 3 (delta 0), reused 3 (delta 0), pack-reused 0
    Unpacking objects: 100% (3/3), done.
    Checking connectivity... done.
If you do it this way, you can be sure you'll always have the latest bug fixes and the latest samples. Once you've cloned the repository, the rest of the book can be followed in the same manner. When we mention <DVD3> in this book, in this case it'll point to the cloned repository.
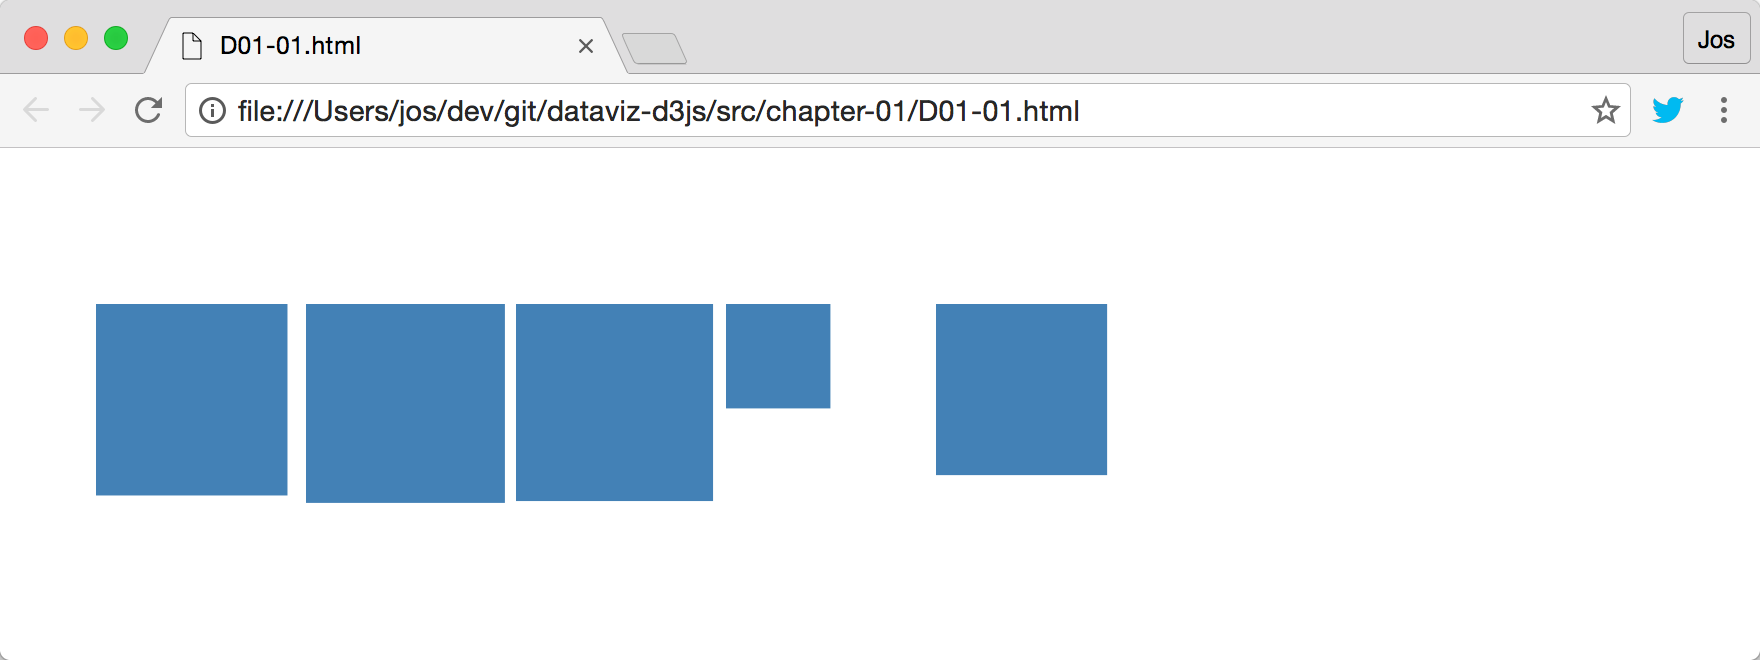
Once you've got the sources extracted to the <DVD3> directory, we could already run some examples by just opening the corresponding HTML file directly. For instance, if you open the <DVD3>/src/chapter-01/D01-01.html file in your browser, you'll see the following results:
While this will work for the basic examples, this won't work when we're loading external data, due to the restriction that you can't use JavaScript to asynchronously load resources from the local filesystem. To get the examples in this book working, which use external data (most of them), we need to set up a local web server. In the following section, we'll explain how to do this.
Setting up the local web server
There are many options for setting up a local web server. For this book, we've created a simple gulp build file which starts a local web server. The advantage of this web server is that it will automatically reload the browser when any of the sources change, which makes developing D3 visualizations a lot more convenient.
To start this web server, we need to first install node.js, which is required to run our build file. Node.js can be downloaded from here: https://nodejs.org/en/download/. Once you've installed node.js, you need to run the following command once (npm install) in the <DVD3> directory:
    $ npm install
    ├─┬ gulp@3.9.1
    │ ├── archy@1.0.0
    ...
    <removed dependencies for clarity>
    ...
        │ └─┬ websocket-driver@0.6.5
        │   └── websocket-extensions@0.1.1
        ├── livereload-js@2.2.2
        └── qs@5.1.0
You will see a large number of dependencies being downloaded, but once it is done, you can simply start the web server by running the npm start command (also in the <DVD3> directory):
    $ npm start

    > dataviz-d3js@1.0.0 start /Users/jos/dev/git/dataviz-d3js
    > gulp

    [11:20:18] Using gulpfile ~/dev/git/dataviz-d3js/gulpfile.js
    [11:20:18] Starting 'connect'...
    [11:20:18] Finished 'connect' after 30 ms
    [11:20:18] Starting 'watch'...
    [11:20:18] Finished 'watch' after 34 ms
    [11:20:18] Starting 'default'...
    [11:20:18] Finished 'default' after 12 μs
    [11:20:18] Server started http://localhost:8080
    [11:20:18] LiveReload started on port 35729
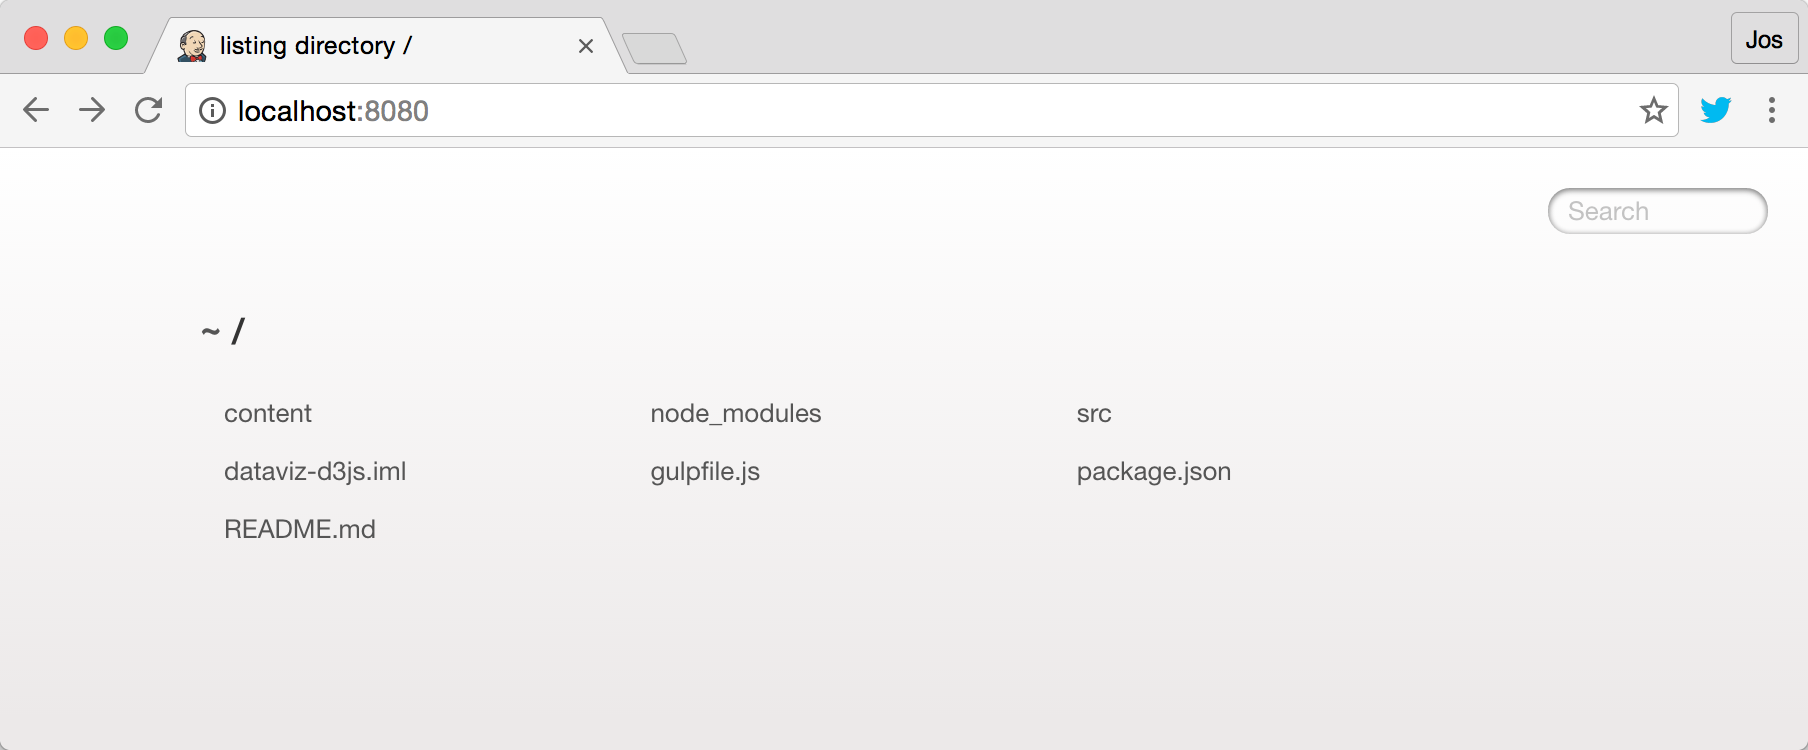
At this point, you've got a web server running at http://localhost:8080. If you now point your browser to this URL, you can access all the examples from your browser:
Note that I use Chrome in all the screenshots. While everyone has their own preference for a browser, I feel that the Chrome browser, currently, has the best developer tools. In the rest of this book, I'll show some examples of how you can use Chrome's developer tools to get more insight into your visualization.


