Reader small image

You're reading from  Expert Data Visualization

Product typeBook
Published inApr 2017
Reading LevelIntermediate
PublisherPackt
ISBN-139781786463494
Edition1st Edition
Languages
Tools
Right arrow
Author (1)
Jos Dirksen
Jos Dirksen
author image
Jos Dirksen

Jos Dirksen has worked as a software developer and architect for almost two decades. He has a lot of experience in many technologies, ranging from backend technologies, such as Java and Scala, to frontend development using HTML5, CSS, JavaScript, and Typescript. Besides working with these technologies, Jos regularly speaks at conferences and likes to write about new and interesting technologies on his blog. He also likes to experiment with new technologies and see how they can best be used to create beautiful data visualizations. Previously, Jos has worked in many different roles in the private and public sectors, ranging from private companies such as ING, ASML, Malmberg, and Philips to organizations in the public sector, such as the Department of Defense and the Port of Rotterdam.
Read more about Jos Dirksen

Right arrow

Visualizing Graphs

So far, we've seen a number of different data structures. We've visualized linear data with bar, pie, and line charts, and have shown how to visualize nested data using trees and treemaps. An important data structure that we haven't looked at yet is the graph. With a graph, we have a number of nodes which are connected to each other to form a network. In this chapter, we'll look at a couple of different approaches you can use to visualize these kinds of structures.

In this chapter, we'll show the following D3 supported visualizations:

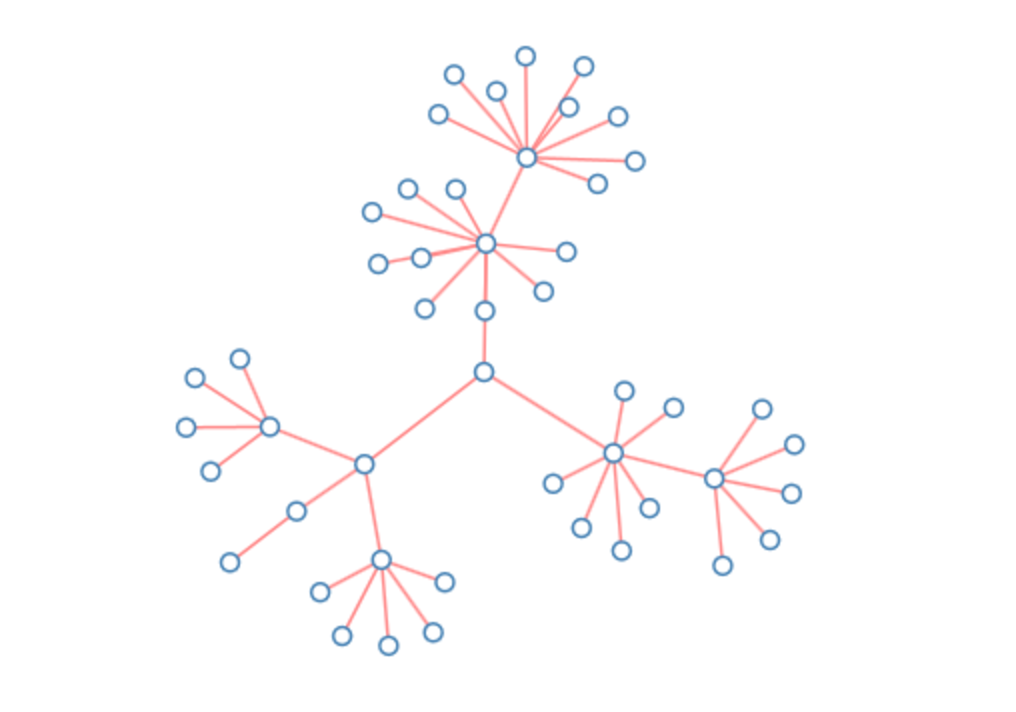
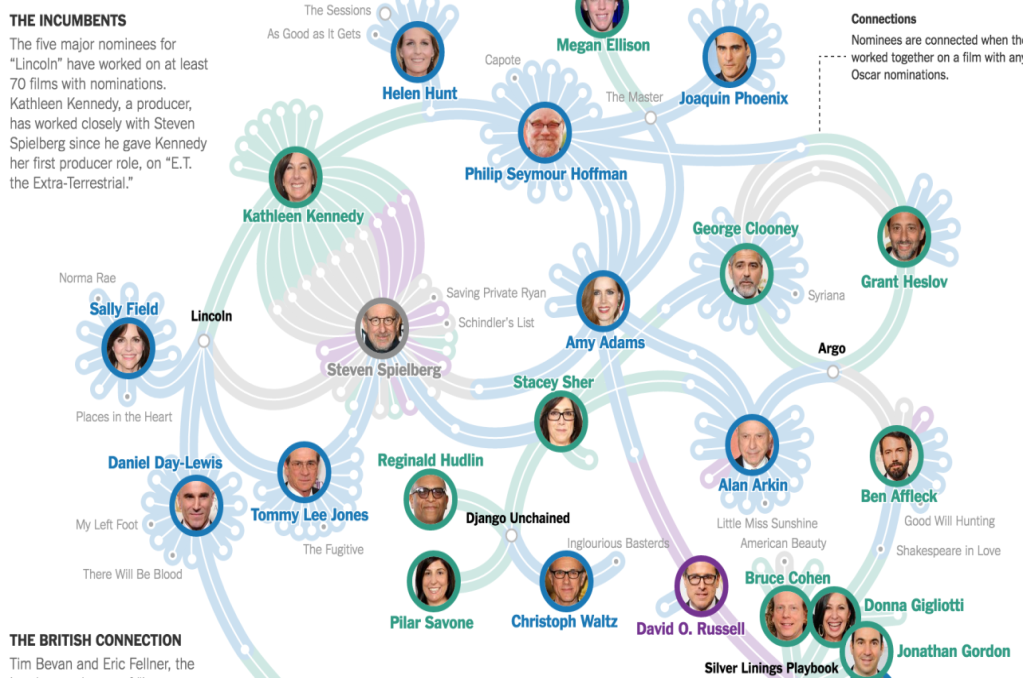
  • We'll start with the force layout. With a force layout, we can create force-directed graphs. In a force-directed graph, the nodes are connected to each other with links. All the nodes and links can exact forces on one another which will result in visually pleasing network of nodes. We will visualize this using data from the Simpsons...

Force layout

A force layout renders a graph as a set of nodes and interconnected links. It's easiest to visualize by looking at an example. The following graph is a very simple example of what you can create with a force layout:

While this is a very simple example, if you have the time, you can create beautiful layouts. An especially beautiful one is the one created by (amongst others) the creator of D3:

You can interact with this visualization here: http://www.nytimes.com/interactive/2013/02/20/movies/among-the-oscar-contenders-a-host-of-connections.html.

For our first visualization in this chapter, we're going to create a force layout that uses information from the Simpsons. We're going to show which characters appear in a specific location in an episode. The final result looks something like this:

Here we have a force layout (which you can see in DVD3/src/chapter-04/D04-01.html) with the following...

Bubble chart

In this section, we're going to create the following bubble chart. This chart shows which word throughout all the Simpsons episodes is spoken the most by a specific character:

This bubble chart has the following features:

  • The size of a circle represents how often that word is spoken
  • It uses a force layout to position the bubbles
  • We use a custom force function to group the words together for each character
  • You can drag and drop individual words
  • When you hover over a word, the word is shown at the bottom, and the character who said it is highlighted

But first we need to create the data that we'll use for this chart.

Getting the data

For this data, we're going to use the same database we used in the beginning of this chapter. This time...

Chord diagram

The force layout we've seen at the beginning of this chapter can nicely be used to show the relations of a graph. An alternative way we can show relations is in a chord diagram. With a chord diagram, all the nodes are moved to the edge of a circle, and ribbons are drawn between nodes that have a relation with each other. The size of the ribbon reflects the weight of the relation. In this section, we're going to create the following chord diagram:

In this diagram, we show when specific characters appeared together in a specific location. We don't do this for a single episode, but show this for a complete season. In this case, we used season 22. When you open this example (<DVD3>/chapter04/D04-03.html), you can see that the chord diagram also responds to mouse events. When you hover over an edge, the chord diagram will only show the outgoing connections from this specific edge and...

Matrix diagram

For the last visualization of this chapter, we're going to create a matrix diagram. With a matrix diagram, we visualize the graph of nodes as a single matrix. For this example, we'll visualize the most important Simpsons characters as they appear together in a scene. The result that we'll create is this:

This visualization provides the following features:

  • It shows a matrix where the intensity of the color reflects how often characters appear together in a location.
  • When you hover you mouse, it changes the opacity of the row and column to better identify the two characters the value applies to.
  • When you click on the visualization, it changes sorting order. By default, the sort order is on the total amount of appearances a character has. If you click, it changes to sort on the number of unique characters the character appears with.
  • At the bottom, the value of a specific matrix cell...

Summary

In this chapter, we've explored a number of different ways you can visualize graphs of data. D3 provides a number of different standard tools and techniques to visualize these data structures. A very versatile one is the d3.force layout. With this layout, you specify how the various parts of the graph (the nodes and the edges) influence each other, and by running the simulation, D3 moves the elements to their correct positions. While very versatile, it can quickly become unreadable when the number of interconnections increases. For an alternative to the force layout, D3 provides a chord layout. With the chord layout, we can easily visualize more complex interactions in a compact visualization. The last visualization we showed in this chapter uses a matrix layout, where we created a big table that allows you to quickly see the links between elements without having to follow lines or ribbons.

So far,...

lock icon
The rest of the chapter is locked
You have been reading a chapter from
Expert Data Visualization
Published in: Apr 2017Publisher: PacktISBN-13: 9781786463494
Register for a free Packt account to unlock a world of extra content!
A free Packt account unlocks extra newsletters, articles, discounted offers, and much more. Start advancing your knowledge today.
undefined
Unlock this book and the full library FREE for 7 days
Get unlimited access to 7000+ expert-authored eBooks and videos courses covering every tech area you can think of
Renews at $15.99/month. Cancel anytime

Author (1)

author image
Jos Dirksen

Jos Dirksen has worked as a software developer and architect for almost two decades. He has a lot of experience in many technologies, ranging from backend technologies, such as Java and Scala, to frontend development using HTML5, CSS, JavaScript, and Typescript. Besides working with these technologies, Jos regularly speaks at conferences and likes to write about new and interesting technologies on his blog. He also likes to experiment with new technologies and see how they can best be used to create beautiful data visualizations. Previously, Jos has worked in many different roles in the private and public sectors, ranging from private companies such as ING, ASML, Malmberg, and Philips to organizations in the public sector, such as the Department of Defense and the Port of Rotterdam.
Read more about Jos Dirksen