


The following is Wikipedia's definition of machine learning:
"Machine learning is a scientific discipline that explores the construction and study of algorithms that can learn from data."
Essentially, machine learning is the process of using past data to make predictions about the future. Machine learning heavily depends upon statistical analysis and methodology.
In statistics, there are four types of measurement scales:
Scale type | Description |
Nominal scale |
|
Ordinal scale |
|
Interval scale |
|
Ratio scale |
|
Another distinction that...
Before understanding vectors, let's focus on what a point is. A point is just a set of numbers. This set of numbers or coordinates defines the point's position in space. The number of coordinates determines the dimensions of the space.
We can visualize space with up to three dimensions. A space with more than three dimensions is called hyperspace. Let's put this spatial metaphor to use.
Let's start with a house. A house may have the following dimensions:
- Area
- Lot size
- Number of rooms
We are working in three-dimensional space here. Thus, the interpretation of point (4500, 41000, 4) would be 4500 sq. ft area, 41k sq. ft lot size, and four rooms.
Points and vectors are the same thing. Dimensions in vectors are called features. In another way, we can define a feature as an individual measurable property of a phenomenon being observed.
Spark has local vectors and matrices and also distributed matrices. A distributed matrix is backed by one or more RDDs. A local vector has...
Correlation is a statistical relationship between two variables such that when one variable changes, it leads to a change in the other variable. Correlation analysis measures the extent to which the two variables are correlated.We see correlation in our daily life. The height of a person is correlated with the weight of a person, the load carrying capacity of a truck is correlated with the number of wheels it has, and so on.
If an increase in one variable leads to an increase in another, it is called a positive correlation. If an increase in one variable leads to a decrease in the other, it is a negative correlation.
Spark supports two correlation algorithms: Pearson and Spearman. The Pearson algorithm works with two continuous variables, such as a person's height and weight or house size and house price. Spearman deals with one continuous and one categorical variable, for example, zip code and house price.
When working on a data pipeline, there are two activities that take up most of the time: data cleaning/data preparation and feature extraction. We already covered data cleaning in the previous chapters. In this recipe, we are going to discuss different aspects of feature engineering.
When it comes to feature selection, there are two primary aspects:
- Quality of features
- Number of features
Every feature is created different from others. Consider the house pricing problem again. Let's look at some of the features of a house:
- House size
- Lot size
- Number of rooms
- Number of bathrooms
- Type of parking garage (carport versus covered)
- School district
- Number of dogs barking in the house
- Number of birds chirping in backyard trees
The last two features may look ridiculous to you, and you might wonder what that has got to do with the house price, and you are right. At the same time, if these features are given to the machine learning algorithm,...
Spark ML is a nickname for the DataFrame-based MLLib API. Spark ML is the primary library now, and the RDD-based API has been moved to maintenance mode.
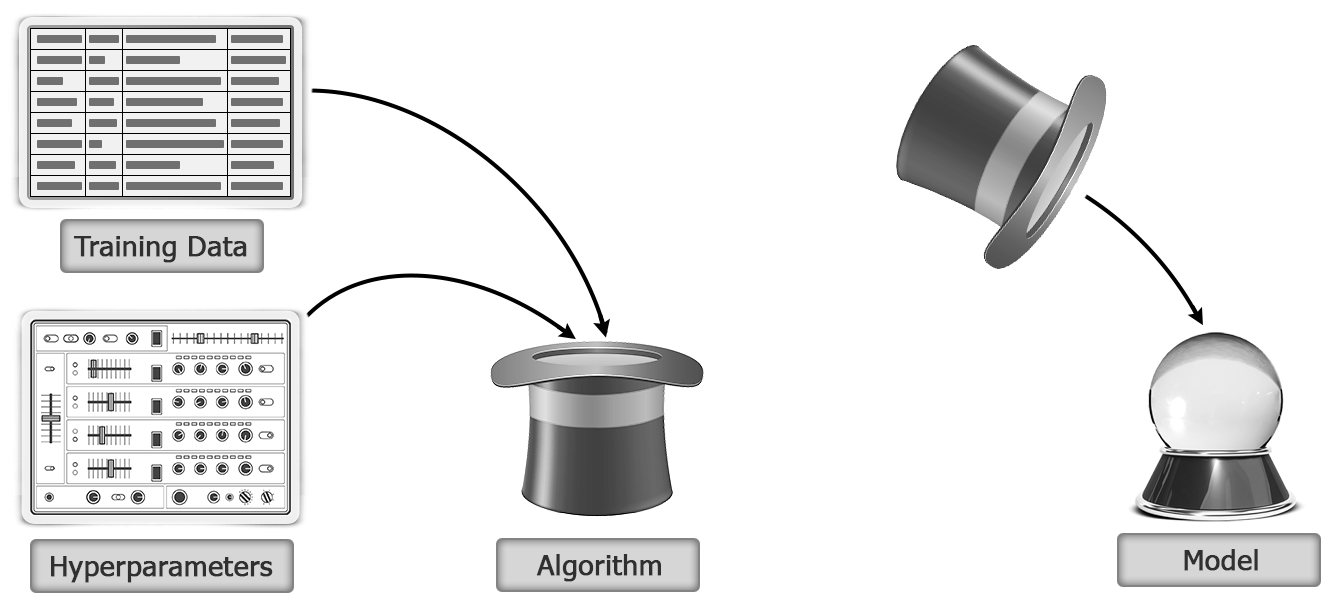
Let's first understand some of the basic concepts in Spark ML. Before that, let's quickly go over how the learning process works. Following are the steps:
- A machine learning algorithm is provided a training dataset along with the right hyperparameters.
- The result of training is a model. The following figure illustrates the model building by applying machine learning algorithm on training data with hyperparameters:
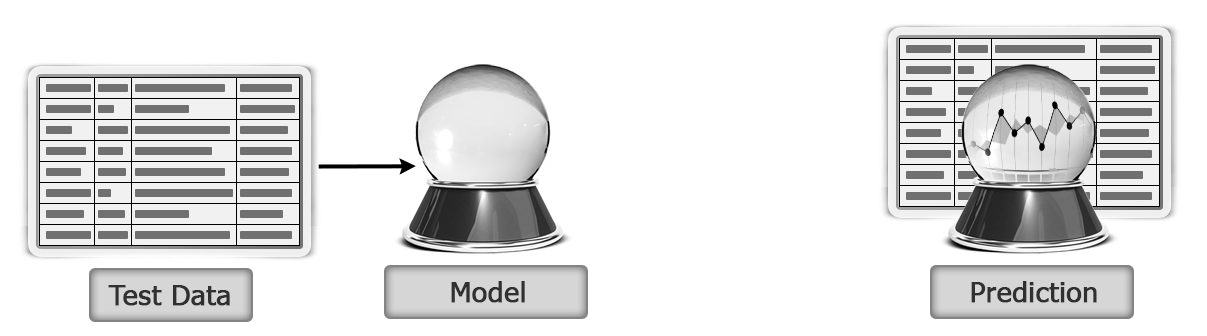
- The model is then used to make predictions on test data as shown here:
In Spark ML, an estimator is provided as a DataFrame (via the fit method), and the output after training is a Transformer:
Now, the Transformer takes one DataFrame as input and outputs another transformed (via the transform method) DataFrame. For example, it can take a DataFrame with the test data and enrich this DataFrame with...
Every ML algorithm (let's start calling it estimator from now on) needs some hyperparameters to be set before it can be trained. These hyperparameters have traditionally been set by hand. Some examples of hyperparameters are step size, number of steps (learning rate), regularization parameters, and so on.
Typically, hyperparameter tuning is a detour in model selection as you already need to know the best value of hyperparameters for training the model. At the same time, to find the right hyperparameters, you need to be able to look ahead at the accuracy. This is where evaluators come into the picture.
In this recipe, we are going to consider an example of linear regression. The focus here is on hyperparameter tuning, so details about linear regression are skipped and covered in depth in the next chapter.