


Data profiling
The four-step dataset design process can be immediately followed by a technical analysis of the source data for the required fact and dimension tables of the dataset. Technical metadata, including database diagrams and data profiling results, such as the existence of null values in source columns, are essential for the project planning stage. This information is used to ensure the Power BI dataset reflects the intended business definitions and is built on a sound and trusted source.
For example, Figure 1.12 shows a database diagram that describes the schema for the reseller sales business process:
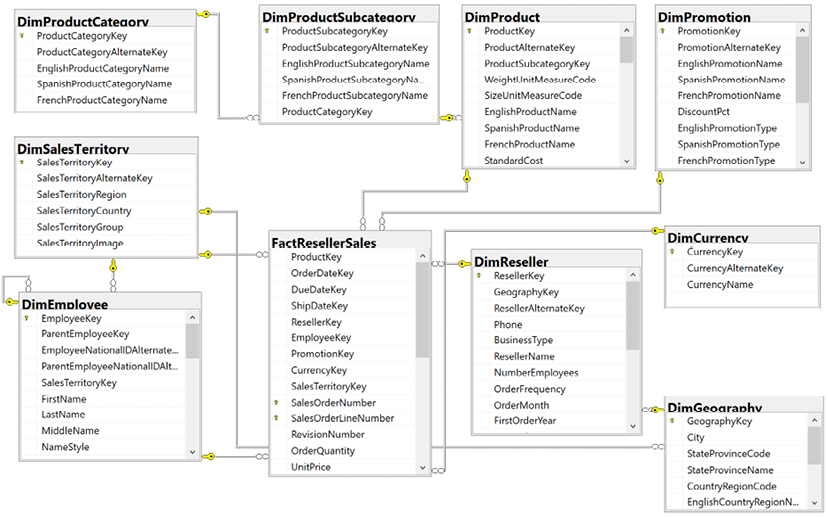
Figure 1.12: SQL Server database diagram: reseller sales
The foreign key constraints (the lines between the tables) identify the surrogate key columns used in the relationships of the Power BI dataset and the referential integrity of the source database. The columns used as keys are displayed in Figure 1.12 with small key icons to the left of the column name.
In this schema, the product dimension is modeled as three separate dimension tables—DimProduct, DimProductSubcategory, and DimProductCategory. Given the priorities of usability, manageability, and query performance, a single denormalized product dimension table that includes essential Product Subcategory and Product Category columns is generally recommended. This reduces the volume of source queries, relationships, and tables in the data model and improves report query performance, as fewer relationships must be scanned by the dataset engine.
Clear visibility of the source system, including referential and data integrity constraints, data quality, and any MDM processes, is essential. Unlike other popular BI tools, Power BI is capable of addressing many data integration and quality issues, particularly with relational database sources that Power BI can leverage to execute data transformation operations. However, Power BI’s extract, transform, load (ETL) capabilities are not a substitute for data warehouse architecture and enterprise ETL tools, such as SQL Server Integration Services (SSIS).
For example, it’s the responsibility of the data warehouse to support historical tracking with slowly changing dimension ETL processes that generate new rows and surrogate keys for a dimension when certain columns change. To illustrate a standard implementation of slowly changing dimensions, Figure 1.13 shows the results of a query of the DimProduct table in the Adventure Works data warehouse returning three rows for one product (FR-M94B-38):

Figure 1.13: Historical tracking of dimensions via slowly changing dimension ETL processes
It’s the responsibility of the Power BI team and particularly the dataset designer to accurately reflect this historical tracking via relationships and DAX measures, such as the count of distinct products not sold. Like historical tracking, the data warehouse should also reflect all master data management processes that serve to maintain accurate master data for essential dimensions, such as customers, products, and employees.
In other words, despite many line of business applications and Enterprise Resource Planning (ERP), Customer Relationship Management (CRM), Human Resource Management (HRM), and other large corporate systems that store and process the same master data, the data warehouse should reflect the centrally governed and cleansed standard. Therefore, creating a Power BI dataset that only reflects one of these source systems may later introduce version control issues and, similar to choosing an incorrect granularity for a fact table, can ultimately require costly and invasive revisions.
Different tools are available with data profiling capabilities. If the data source is SQL Server, SSIS can be used to analyze source data intended for use in a project. In Figure 1.14, the Data Profiling task is used in an SSIS package to analyze the customer dimension table:
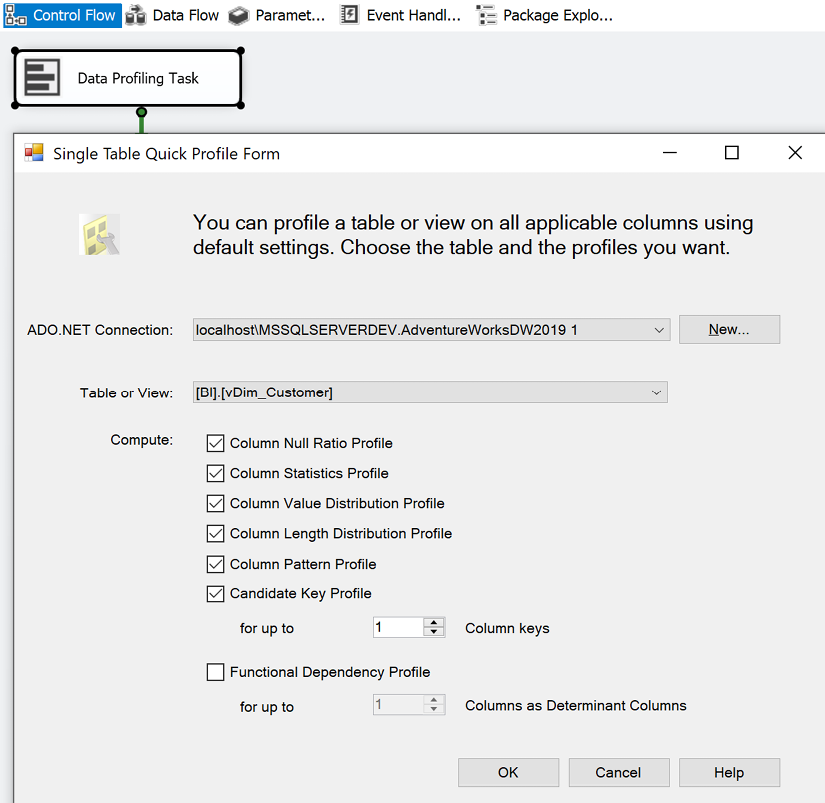
Figure 1.14: Data Profiling task in SSIS
The Data Profiling task requires an ADO.NET connection to the data source and can write its output to an XML file or an SSIS variable. In this example, the ADO.NET data source is the Adventure Works data warehouse database in SQL Server 2016 and the destination is an XML file (DataProfilingData.xml).
Once the task is executed, the XML file can be read via the SQL Server Data Profile Viewer as per the following example. Note that this application, Data Profile Viewer, requires the installation of SQL Server and that the Data Profiling task only works with SQL Server data sources. All fact and dimension table sources can be analyzed quickly for the count and distribution of unique values, the existence of null values, and other useful statistics.
Each Data Profiling task can be configured to write its results to an XML file on a network location for access via tools such as the Data Profile Viewer. In the example shown in Figure 1.15, the Data Profile Viewer is opened from within SSIS to analyze the output of the Data Profiling task for the customer dimension table:
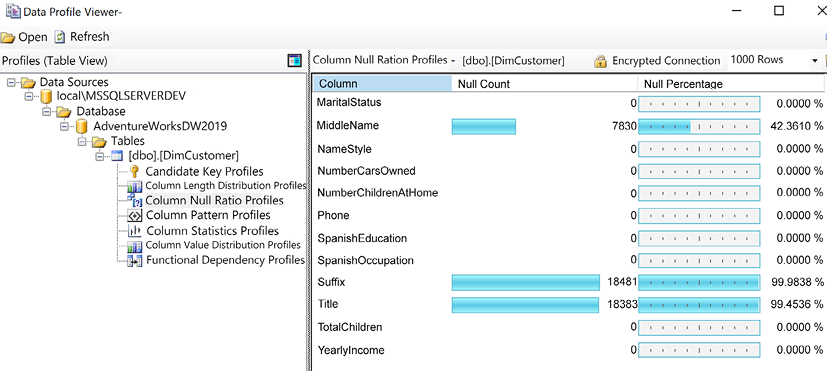
Figure 1.15: Data Profile Viewer: column null ratio profiles of DimCustomer table
Identifying and documenting issues in the source data via data profiling is a critical step in the planning process. For example, the cardinality or count of unique values largely determines the data size of a column in an import mode dataset. Similarly, the severity of data quality issues identified impacts whether a DirectQuery dataset is a feasible option.
In general, enterprise BI teams should utilize enterprise data profiling tools such as those included with SQL Server. However, basic data profiling tools are also available in Power BI Desktop, which we cover next.
Data profiling with Power BI Desktop
Power BI Desktop includes simple data quality reporting within the Power Query Editor interface. The Power Query Editor is used to develop queries for connecting to and ingesting data from source systems and is covered in detail in Chapter 2, Preparing Data Sources.
To access the data quality reporting within Power Query Editor, use the View tab and check the boxes for Column quality, Column distribution, and Column profile as shown in Figure 1.16:
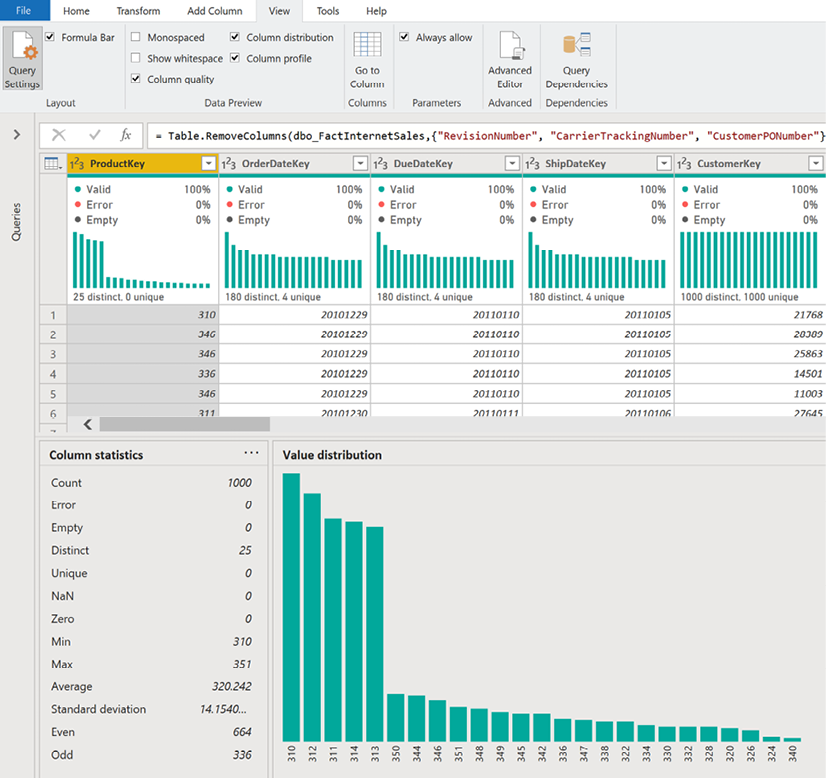
Figure 1.16: Data quality in Power Query Editor
As shown in Figure 1.16, activating the data quality reporting within Power Query Editor displays many important statistics such as the number of distinct values, the value distribution, and the percentage of valid values and errors.
While not as comprehensive as some enterprise data quality tools, the data quality reporting within Power Query Editor is useful as an additional data quality check for data accessed by Power BI Desktop.
Once source data is profiled, the next natural step is dataset planning as covered in the next section.