Reader small image

You're reading from  SQL for Data Analytics

Product typeBook
Published inAug 2019
Reading LevelIntermediate
PublisherPackt
ISBN-139781789807356
Edition1st Edition
Languages
Right arrow
Authors (3):
Upom Malik
Upom Malik
author image
Upom Malik

Upom Malik is a data science and analytics leader who has worked in the technology industry for over 8 years. He has a master's degree in chemical engineering from Cornell University and a bachelor's degree in biochemistry from Duke University. As a data scientist, Upom has overseen efforts across machine learning, experimentation, and analytics at various companies across the United States. He uses SQL and other tools to solve interesting challenges in finance, energy, and consumer technology. Outside of work, he likes to read, hike the trails of the Northeastern United States, and savor ramen bowls from around the world.
Read more about Upom Malik

Matt Goldwasser
Matt Goldwasser
author image
Matt Goldwasser

Matt Goldwasser is the Head of Applied Data Science at the T. Rowe Price NYC Technology Development Center. Prior to his current role, Matt was a data science manager at OnDeck, and prior to that, he was an analyst at Millennium Management. Matt holds a bachelor of science in mechanical and aerospace engineering from Cornell University.
Read more about Matt Goldwasser

Benjamin Johnston
Benjamin Johnston
author image
Benjamin Johnston

Benjamin Johnston is a senior data scientist for one of the world's leading data-driven MedTech companies and is involved in the development of innovative digital solutions throughout the entire product development pathway, from problem definition to solution research and development, through to final deployment. He is currently completing his Ph.D. in machine learning, specializing in image processing and deep convolutional neural networks. He has more than 10 years of experience in medical device design and development, working in a variety of technical roles, and holds first-class honors bachelor's degrees in both engineering and medical science from the University of Sydney, Australia.
Read more about Benjamin Johnston

View More author details
Right arrow

Statistical Significance Testing

Another piece of analysis that is useful in data analysis is statistical significance testing. Often times, an analyst is interested in comparing the statistical properties of two groups, or perhaps just one group before and after a change. Of course, the difference between these two groups may just be due to chance.

An example of where this comes up is in marketing A/B tests. Companies will often test two different types of landing pages for a product and measure the click-through rate (CTR). You may find that the CTR for variation A of the landing page is 10%, and the CTR for variation B is 11%. So, does that mean that variation B is 10% better than A, or is this just a result of day-to-day variance? Statistical testing helps us to determine just that.

In statistical testing, there are a couple of major parts you need to have (Figure 1.32). First, we have the test statistic we are examining. It may be a proportion, an average, the difference between two groups, or a distribution. The next necessary part is a null hypothesis, which is the idea that the results observed are the product of chance. You will then need an alternative hypothesis, which is the idea that the results seen cannot be explained by chance alone. Finally, a test needs a significance level, which is the value the test statistic needs to take before it is decided that the null hypothesis cannot explain the difference. All statistical significance tests have these four aspects, and it is simply a matter of how these components are calculated that differentiate significance tests:

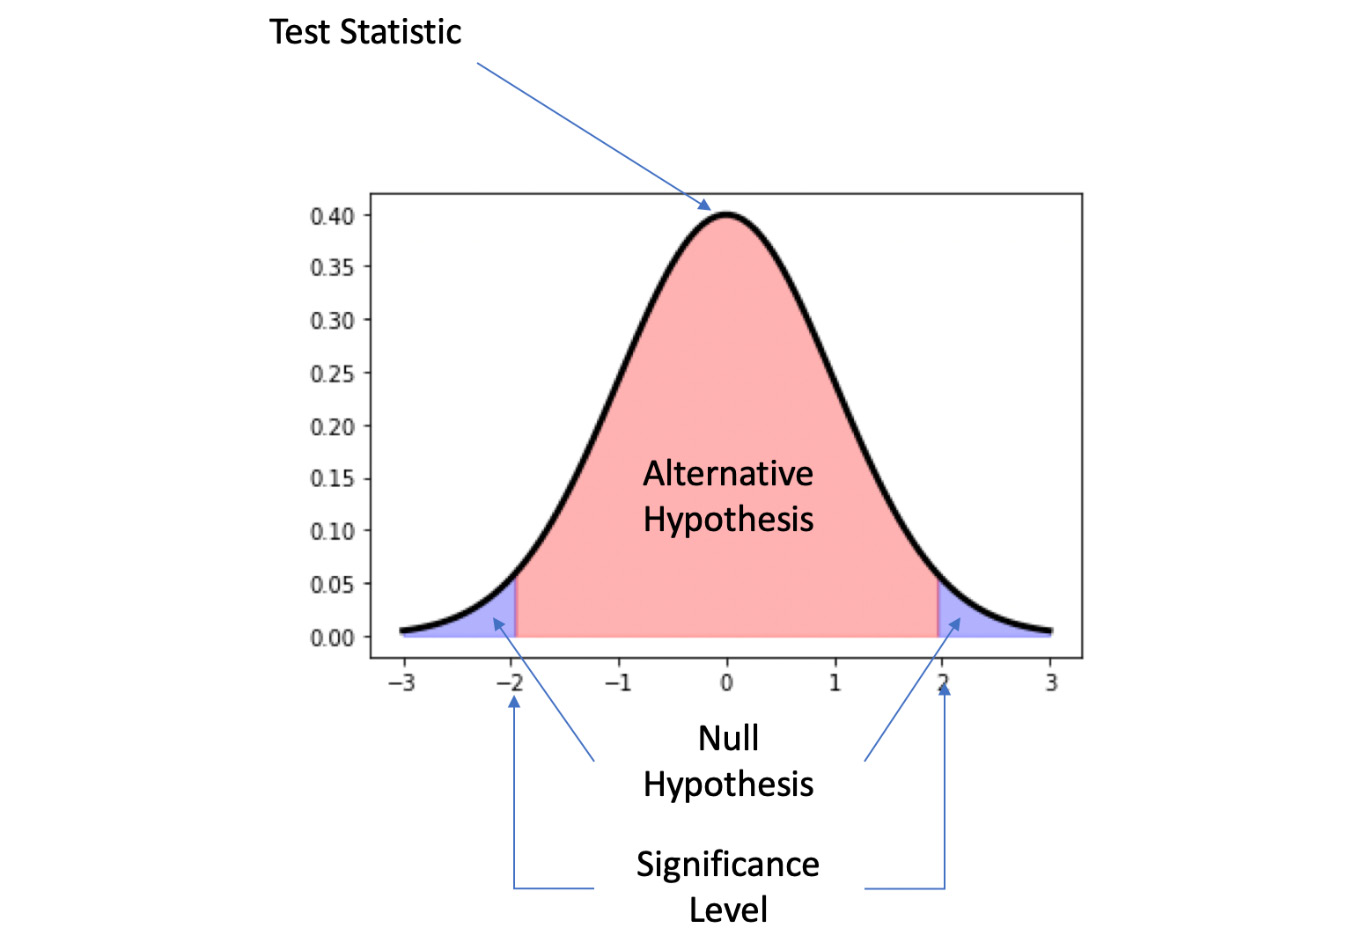
Figure 1.32: Parts of statistical significance testing

Common Statistical Significance Tests

Some common statistical significance tests include the following:

  • Two-sample Z-test: A test to determine whether the averages of the two samples are different. This test assumes that both samples are drawn from a normal distribution with a known population standard deviation.
  • Two-sample T-test: A test to determine whether the average of two samples is different when either the sample set is too small (that is, fewer than 30 data points per sample), or if the population standard deviation is unknown. The two samples are also generally drawn from distributions assumed to be normal.
  • Pearson's Chi-Squared Test: A test to determine whether the distribution of data points to categories is different than what would be expected due to chance. This is the primary test for determining whether the proportions in tests, such as those in an A/B test, are beyond what would be expected from chance.

    Note

    To learn more about statistical significance, please refer to a statistics textbook, such as Statistics by David Freedman, Robert Pisani, and Roger Purves.

Previous PageNext Page
You have been reading a chapter from
SQL for Data Analytics
Published in: Aug 2019Publisher: PacktISBN-13: 9781789807356
Register for a free Packt account to unlock a world of extra content!
A free Packt account unlocks extra newsletters, articles, discounted offers, and much more. Start advancing your knowledge today.
undefined
Unlock this book and the full library FREE for 7 days
Get unlimited access to 7000+ expert-authored eBooks and videos courses covering every tech area you can think of
Renews at $15.99/month. Cancel anytime

Authors (3)

author image
Upom Malik

Upom Malik is a data science and analytics leader who has worked in the technology industry for over 8 years. He has a master's degree in chemical engineering from Cornell University and a bachelor's degree in biochemistry from Duke University. As a data scientist, Upom has overseen efforts across machine learning, experimentation, and analytics at various companies across the United States. He uses SQL and other tools to solve interesting challenges in finance, energy, and consumer technology. Outside of work, he likes to read, hike the trails of the Northeastern United States, and savor ramen bowls from around the world.
Read more about Upom Malik

author image
Matt Goldwasser

Matt Goldwasser is the Head of Applied Data Science at the T. Rowe Price NYC Technology Development Center. Prior to his current role, Matt was a data science manager at OnDeck, and prior to that, he was an analyst at Millennium Management. Matt holds a bachelor of science in mechanical and aerospace engineering from Cornell University.
Read more about Matt Goldwasser

author image
Benjamin Johnston

Benjamin Johnston is a senior data scientist for one of the world's leading data-driven MedTech companies and is involved in the development of innovative digital solutions throughout the entire product development pathway, from problem definition to solution research and development, through to final deployment. He is currently completing his Ph.D. in machine learning, specializing in image processing and deep convolutional neural networks. He has more than 10 years of experience in medical device design and development, working in a variety of technical roles, and holds first-class honors bachelor's degrees in both engineering and medical science from the University of Sydney, Australia.
Read more about Benjamin Johnston