

Big data ecosystem
The big data ecosystem has a fairly large footprint that's contributed by several infrastructures, analytics (BI and AI) technologies, data stores, and apps. Some of these are open source, while others are proprietary. Some are easy to wield, while others have steeper learning curves. Big data management can be daunting as it brings in another layer of challenges over existing data systems. So, it is important to understand what qualifies as a big data system and know what set of tools should be used for the use case at hand.
What characterizes big data?
Big data was initially characterized with three Vs (volume, velocity, and variety). This involves processing a lot of data coming into a system at high velocity with varying data types. Two more Vs were subsequently added (veracity and value). This list continues to grow and now includes variability and visibility. Let's look at the top five and see what each of them mean:
- Volume: This is measured by the size of data, both historical and current:
- The number of records in a file or table
- The size of the data in gigabytes, terabytes, and so on
- Velocity: This refers to the frequency at which new data arrives:
- The batches have a well-defined interval, such as daily or hourly.
- Real time is either continuous or micro-batch, typically in seconds.
- Variety: This refers to the structural nature of the data:
- Structured data is usually relational and has a well-defined schema.
- Semi-structured data has a self-describing schema that can evolve, such as the XML and JSON formats.
- Unstructured data refers to free-text documents, audio, and video data that's usually in binary format.
- Veracity: This refers to the trustworthiness and reliability of the data:
- Lineage refers to not just the source but also the subsequent systems where transformations took place to ensure that data fidelity is maintained and can be audited. To guarantee such reliability, data lineage must be maintained.
- Value: This refers to the business impact that the dataset has – that is, how valuable the data is to the business.
Classifying data
Different classification gauges can be used. The common ones are based on the following aspects:
- As the volume of data increases, we move from regular systems to big data systems. Big data is typically terabytes of data that cannot fit on a single computer node.
- As the velocity of the data increases, we move toward big data systems specialized in streaming. In batch systems, irrespective of when data arrives, it is processed at a predefined regular interval. In streaming systems, there are two flavors. If it's set to continuous, data is processed as it comes. If it's set to micro-batch, data is aggregated in small batches, typically a few seconds or milliseconds.
- When it comes to variety – that is, the structure of the data – we move toward the realm of big data systems. In structured data, the schema is well known and stable, so it's assumed to be fairly static and rigid to the definition. With semi-structured data, the schema is built into the data and can evolve. In unstructured data such as images, audio, and video, there is some metadata but no real schema to the binary data that's sent.
The following diagram shows what trends in data characteristics signal a move toward big data systems. For example, demographic data is fairly structured with predefined fields, operational data moves toward the semi-structured realm as schemas evolve, and the most voluminous is behavioral data as it encompasses user sentiment, which is constantly changing and is best captured by unstructured data such as text, audio, and images:
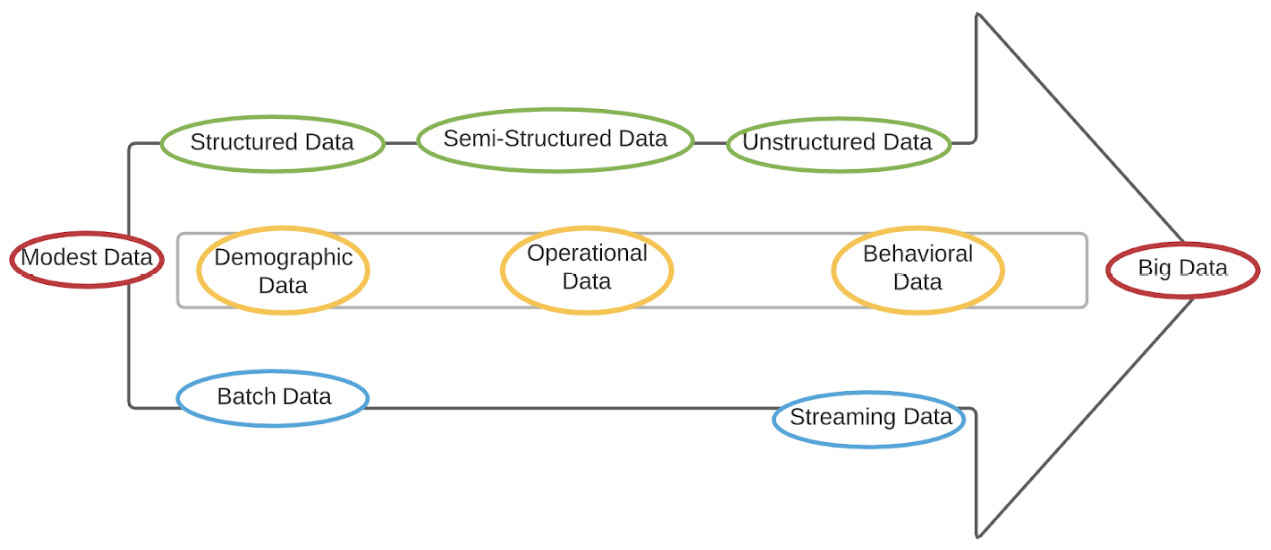
Figure 1.5 – Classifying data
Now that we have covered the different types of data, let's see how much processing needs to be done before it can be consumed.
Reaping value from data
As data is refined and moves further along the pipeline, there is a tradeoff between the value that's added and the cost of the data. In other words, more time, effort, and resources are used, which is why the cost increases, but the value of the data increases as well:

Figure 1.6 – The layers of data value
The analogy we're using here is that of cutting carbon to create a diamond. The raw data is the carbon, which gets increasingly refined. The longer the processing layers, the more refined and curated the value of the data. However, it is more time-consuming and expensive to produce the artifact.
Top challenges of big data systems
People, technology, and processes are the three prongs that every enterprise has to keep up with. Technology changes around us at a pace that is hard to keep up with and gives us better tools and frameworks. Tools are great but until you train people to use them effectively, you cannot create solutions, which is what a business needs. Sound and effective business processes help you pass information quickly and break data silos.
According to Gartner, the three main challenges of big data systems are as follows:
- Data silos
- Fragmented tools
- People with the skill sets to wield them
The following diagram shows these challenges:

Figure 1.7 – Big data challenges
Any imbalance or immaturity in these areas results in poor insights. These challenges around data quality and data staleness lead to inaccurate, delayed, and hence unusable insights.