

After introducing the main topic of the book, it is time to discover the programming environment we will use for our regression analysis. As specified by the title of the book, we will perform our examples in the R environment.
R is an interpreted programming language that allows the use of common facilities for controlling the flow of information, and modular programming using a large number of functions. Most of the available features are written in R. It is also possible for the user to interface with procedures written in C, C ++, or FORTRAN.
R is a GNU project that draws its inspiration from the S language; in fact R is similar to S and can be considered as a different implementation of S. R was developed by John Chambers and his colleagues at Bell Laboratories. There are some significant differences between R and S, but a large amount of the code written for S runs unaltered under R too. R is available as free software under the terms of the Free Software Foundation's (FSF) GNU General Public License (GPL) in source code form.
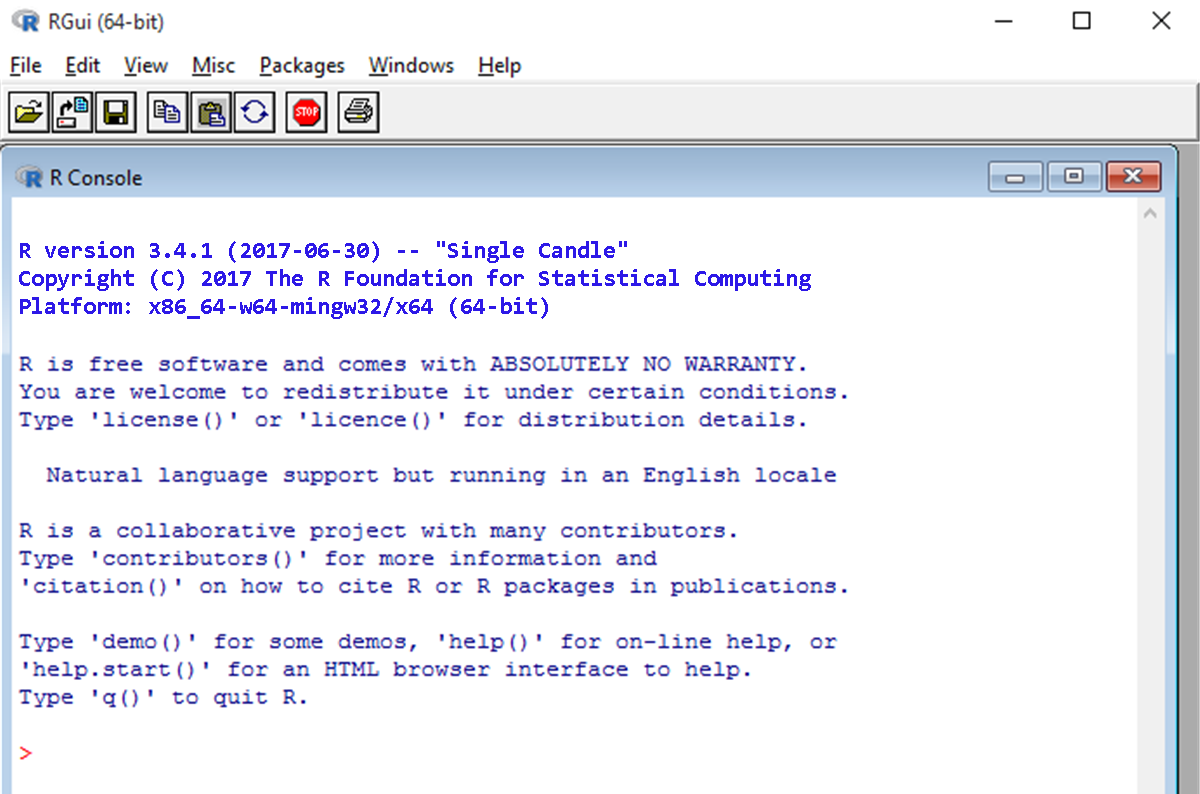
Let's specify the definition we just introduced to present R. In fact, R represents a programming environment originally developed for statistical computation and for producing quality graphs. It consists of a language and runtime environment with a graphical interface, a debugger, and access to some system features. It provides the ability to run programs stored in script files. In the following figure, the R version 3.4.1 interface is shown:
R is an integrated computing system whose resources allow you to:
- Specify a set of commands and require these to run
- View results in text format
- View the charts in an auxiliary window
- Access external archives, even the web-based ones, to capture documents, data, and charts
- Permanently store results and/or graphics
What makes R so useful and explains its quick appreciation from users? The reason lies in the fact that statisticians, engineers, and scientists who have used the software over time have developed a huge collection of scripts grouped in packages. Packages written in R are able to add advanced algorithms, textured color graphics, and data mining techniques to better analyze the information contained in a database.
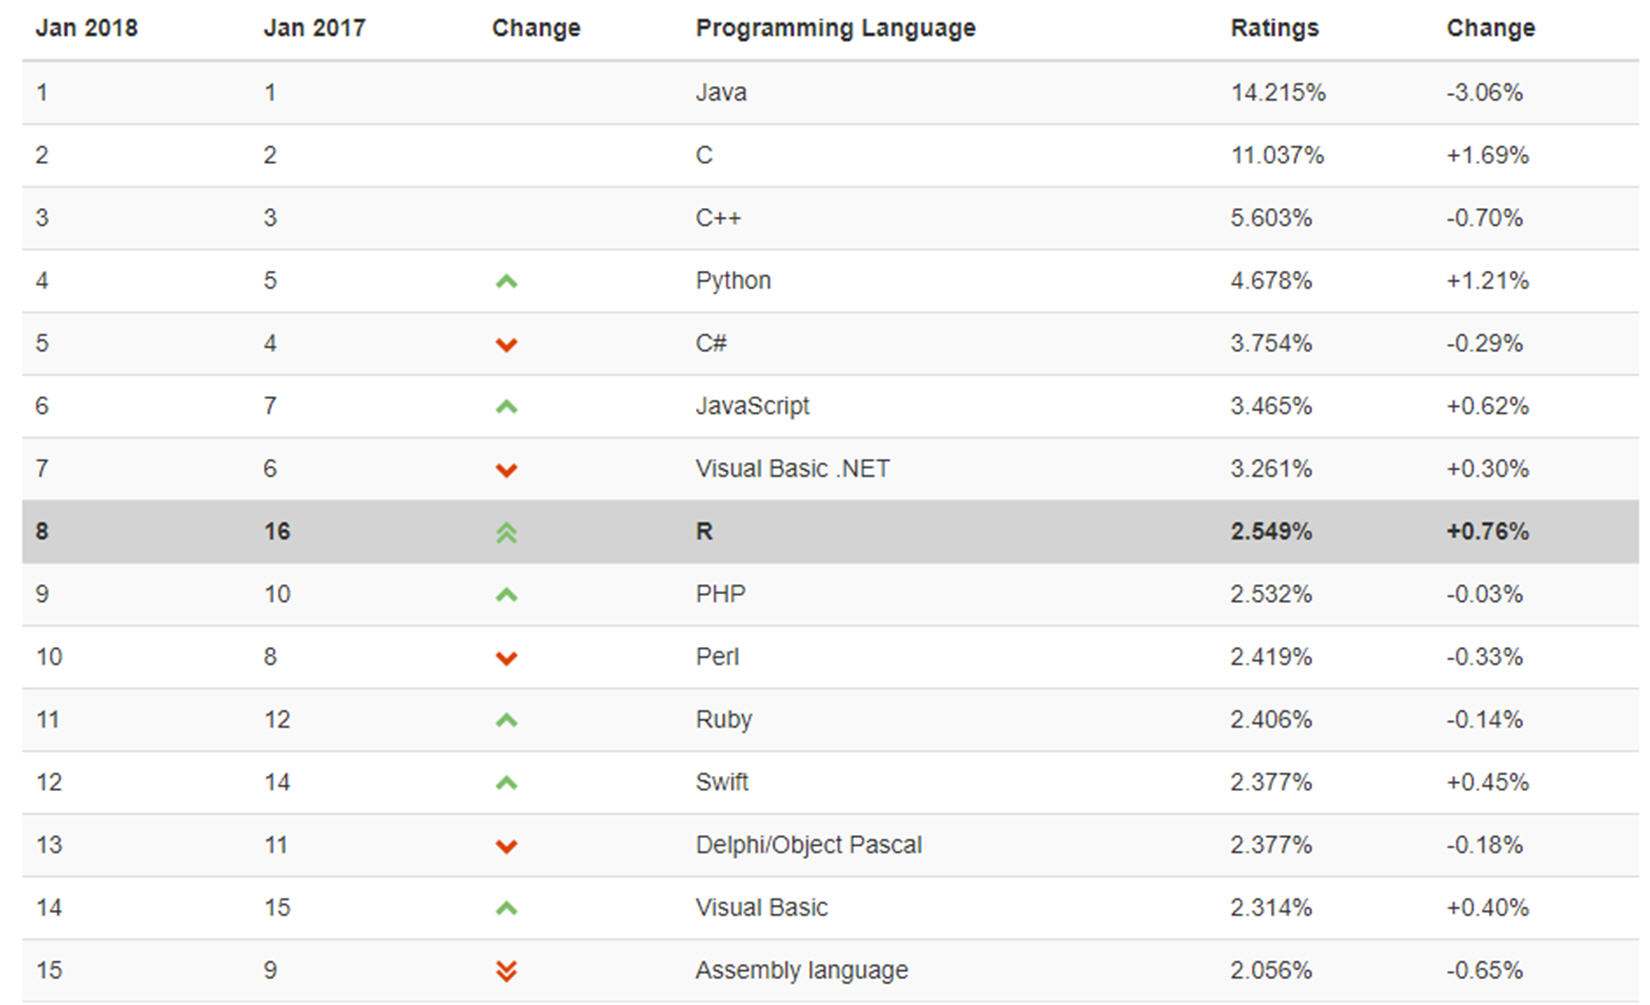
Its popularity among developers has resulted in its rapid rise among the most widely used programming languages, so over the last 1 year, the TIOBE index has been well ahead by seven positions. The TIOBE programming community index is a way to measure how popular a programming language is, and is updated once a month.
Note
The TIOBE programming community index is available at the following link: https://www.tiobe.com/tiobe-index/.
These ratings are derived on the basis of the number of skilled engineers worldwide, courses, and third-party vendors, and are calculated using popular search engines such as Google, Bing, Yahoo!, Wikipedia, Amazon, YouTube, and Baidu. In the following figure, the first fifteen positions of the TIOBE index for January, 2018 are shown:
R is an open source program, and its popularity reflects a change in the type of software used within the company. We remind you that open source software is free from any constraints not only on its use, but more importantly, on its development. Large IT companies such as IBM, Hewlett-Packard, and Dell are able to earn billions of dollars a year by selling servers running the Linux open source operating system, which is Microsoft Windows' competitor.
The widespread use of open source software is now a consolidated reality. Most websites are managed through an open source web application called Apache, and companies are increasingly relying on the MySQL open source database to store information. Finally, many people see the end results of this technology using the open source Firefox web browser.
R is in many respects similar to other programming languages, such as C, Java, and Perl. Because of its features, it is extremely simple and fast to do a wide range of computing tasks, as it provides quick access through various commands. For statisticians, however, R is particularly useful because it contains a number of integrated mechanisms (built-in functions) to organize data, to perform calculations on information, and to create graphic representations of databases.
Indeed, R is highly extensible and provides a wide variety of statistical (linear and nonlinear modeling, classical statistical tests, time-series analysis, classification, clustering, and so on) and graphical techniques. There is also a wide range of features that provide a flexible graphical environment for creating various types of data presentations. Additional forms of (add-on) packages are available for a variety of specific purposes. These are topics that we will look at in the following sections.