Regression in the real world
In general, statistics—and more specifically, regression—is a math discipline. Its purpose is to obtain information from data about knowledge, decisions, control, and the forecasting of events and phenomena. Unfortunately, statistical culture, and in particular statistical reasoning, are scarce and uncommon. This is due to the institutions that have included the study of this discipline in their programs and study plans inadequately. Often, inadequate learning methods are adopted since this is a rather complex and not very popular topic (as is the case with mathematics in general).
The difficulties faced by students are often due to outdated teaching methods that are not in tune with our modern needs. In this book, we will learn how to deal with such topics with a modern approach, based on practical examples. In this way, all the topics will seem simple and within our reach.
Yet regression, given its cross-disciplinary characteristics, has numerous and varied areas of application, from psychology to agrarianism, and from economics to medicine and business management, just to name a few.
The purpose of regression as a statistical tool are of two types, synthesize and generalize, as shown in the following figure:
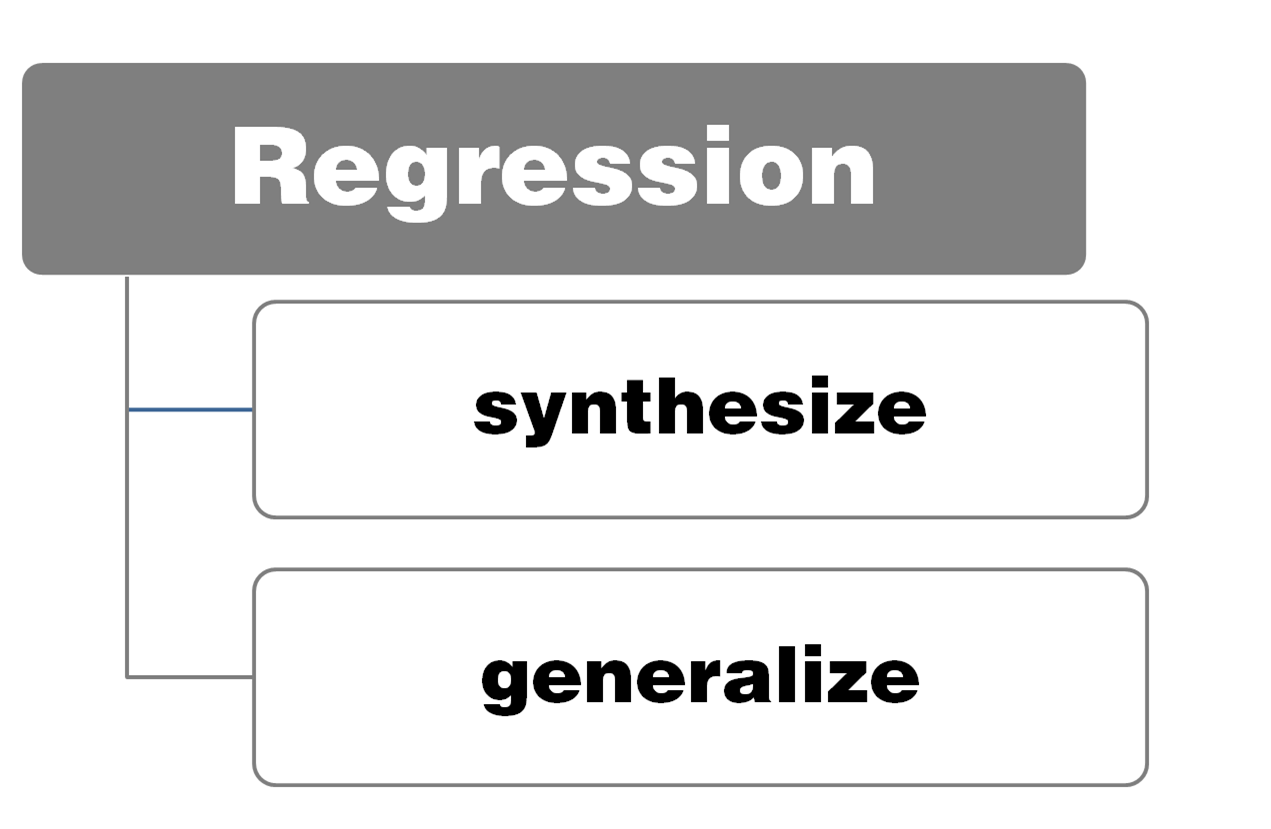
synthesize means predisposing collected data into a form (tables, graphs, or numerical summaries), which allows you to better understand the phenomena on which the detection was performed. The synthesis is met by the need to simplify, which in turn results from the limited ability of the human mind to handle articulated, complex, or multidimensional information. In this way, we can use techniques that allow for a global study of a large number of quantitative and qualitative information to highlight features, ties, differences, or associations between detected variables.
The second purpose (generalize) is to extend the result of an analysis performed on data of a limited group of statistical units (sample) to the entire population group (population).
The contribution of regression is not limited to the data analysis phase. It's true that added value is expressed in the formulation of research hypotheses, argumentation of theses, adoption of appropriate solutions and methodologies, choices of methods of detection, formulation of the sample, and the procedure of extending the results to the reference universes.
Keeping these phases under control means producing reliable and economically useful results, and mastering descriptive statistics and data analysis as well as inferential ones. In this regard, we recall that the descriptive statistics are concerned with describing the experimental data with few significant numbers or graphs. Therefore, they photographs a given situation and summarizes its salient characteristics. The inferential statistics use statistical data, also appropriately summarized by the descriptive statistics, to make probabilistic forecasts on future or otherwise uncertain situations.
People, families, businesses, public administrations, mayors, ministers, and researchers constantly make decisions. For most of them, the outcome is uncertain, in the sense that it is not known exactly what will result, although the expectation is that they will achieve the (positive) effects they are hoping for. Decisions would be better and the effects expected closer to those desired if they were made on the basis of relevant data in a decision-making context. Here are some applications of regression in the real world:
- A student who graduates this year must choose the faculty and university degree course on which he/she will enroll. Perhaps he/she has already gained a vocation for his future profession, or studies have confirmed his/her predisposition for a particular discipline. Maybe a well-established family tradition advises him/her to follow the parent's profession. In these cases, the uncertainty of choice will be greatly reduced. However, if the student does not have genuine vocations or is not geared particularly to specific choices, he or she may want to know something about the professional outcomes of the graduates. In this regard, some statistical study on graduate data from previous years may help him/her make the decision.
- A distribution company, such as a supermarket chain, wants to open a new sales outlet in a big city and must choose the best location. It will use and analyze numerous statistical data on the density of the population in different neighborhoods, the presence of young families, the presence of children under the age of six (if it is interested in selling to this category of consumers), and the presence of schools, offices, other supermarkets, and retail outlets.
- Another company wants to invest its profits. It must make a portfolio choice. It has to decide whether to invest in government bonds, national shares, foreign securities, funds, or real estate. To make this choice, it will first conduct an analysis of the returns and risks of different investment alternatives based on statistical data.
- National governments are often called upon to make choices and decisions. To do this, they have statistical production equipment. They have population data and forecasts about population evolution over the coming years, which will calibrate their interventions. A strong decline in birth rates will, for example, recommend school consolidation policies; the emergence of children from the non-community component will signal the need for reviewing multi-ethnic programs and, more generally, school integration policies. On the other hand, statistical data on the presence of national products in foreign markets will suggest the need to export support actions or interventions to promote innovation and business competitiveness.
In the examples we have seen so far, the usefulness of statistical techniques, and particularly of regression in the most diverse working situations, is clear. It is therefore clear how much more information and data companies are required to have to ensure the rationality of decisions and economic behaviors by those who direct them.