Reader small image

You're reading from  Machine Learning with Swift

Product typeBook
Published inFeb 2018
Reading LevelIntermediate
PublisherPackt
ISBN-139781787121515
Edition1st Edition
Languages
Tools
Right arrow
Authors (3):
Jojo Moolayil
Jojo Moolayil
author image
Jojo Moolayil

Jojo Moolayil is a data scientist, living in Bengaluru—the silicon valley of India. With over 4 years of industrial experience in Decision Science and IoT, he has worked with industry leaders on high impact and critical projects across multiple verticals. He is currently associated with GE, the pioneer and leader in data science for Industrial IoT. Jojo was born and raised in Pune, India and graduated from University of Pune with a major in information technology engineering. With a vision to solve problems at scale, Jojo found solace in decision science and learnt to solve a variety of problems across multiple industry verticals early in his career. He started his career with Mu Sigma Inc., the world's largest pure play analytics provider where he worked with the leaders of many fortune 50 clients. With the passion to solve increasingly complex problems, Jojo touch based with Internet of Things and found deep interest in the very promising area of consumer and industrial IoT. One of the early enthusiasts to venture into IoT analytics, Jojo converged his learnings from decision science to bring the problem solving frameworks and his learnings from data and decision science to IoT. To cement his foundations in industrial IoT and scale the impact of the problem solving experiments, he joined a fast growing IoT Analytics startup called Flutura based in Bangalore and headquartered in the valley. Flutura focuses exclusively on Industrial IoT and specializes in analytics for M2M data. It is with Flutura, where Jojo reinforced his problem solving skills for M2M and Industrial IoT while working for the world's leading manufacturing giant and lighting solutions providers. His quest for solving problems at scale brought the 'product' dimension in him naturally and soon he also ventured into developing data science products and platforms. After a short stint with Flutura, Jojo moved on to work with the leaders of Industrial IoT, that is, G.E. in Bangalore, where he focused on solving decision science problems for Industrial IoT use cases. As a part of his role in GE, Jojo also focuses on developing data science and decision science products and platforms for Industrial IoT.
Read more about Jojo Moolayil

Alexander Sosnovshchenko
author image
Alexander Sosnovshchenko

Alexander Sosnovshchenko has been working as an iOS software engineer since 2012. Later he made his foray into data science, from the first experiments with mobile machine learning in 2014, to complex deep learning solutions for detecting anomalies in video surveillance data. He lives in Lviv, Ukraine, and has a wife and a daughter.
Read more about Alexander Sosnovshchenko

View More author details
Right arrow

Chapter 4. K-Means Clustering


In this chapter, we're going to switch our attention from supervised learning to unsupervised learning. The algorithms that we'll discuss and implement in this chapter are k-means and k-means++ clustering.

In this chapter, we will cover the following topics:

  • Instance-based algorithm of k-means clustering
  • The shortcomings of the k-means and how to fix them with the k-means++
  • Where you can use k-means and where you shouldn't use it
  • Application of clustering for signal quantization
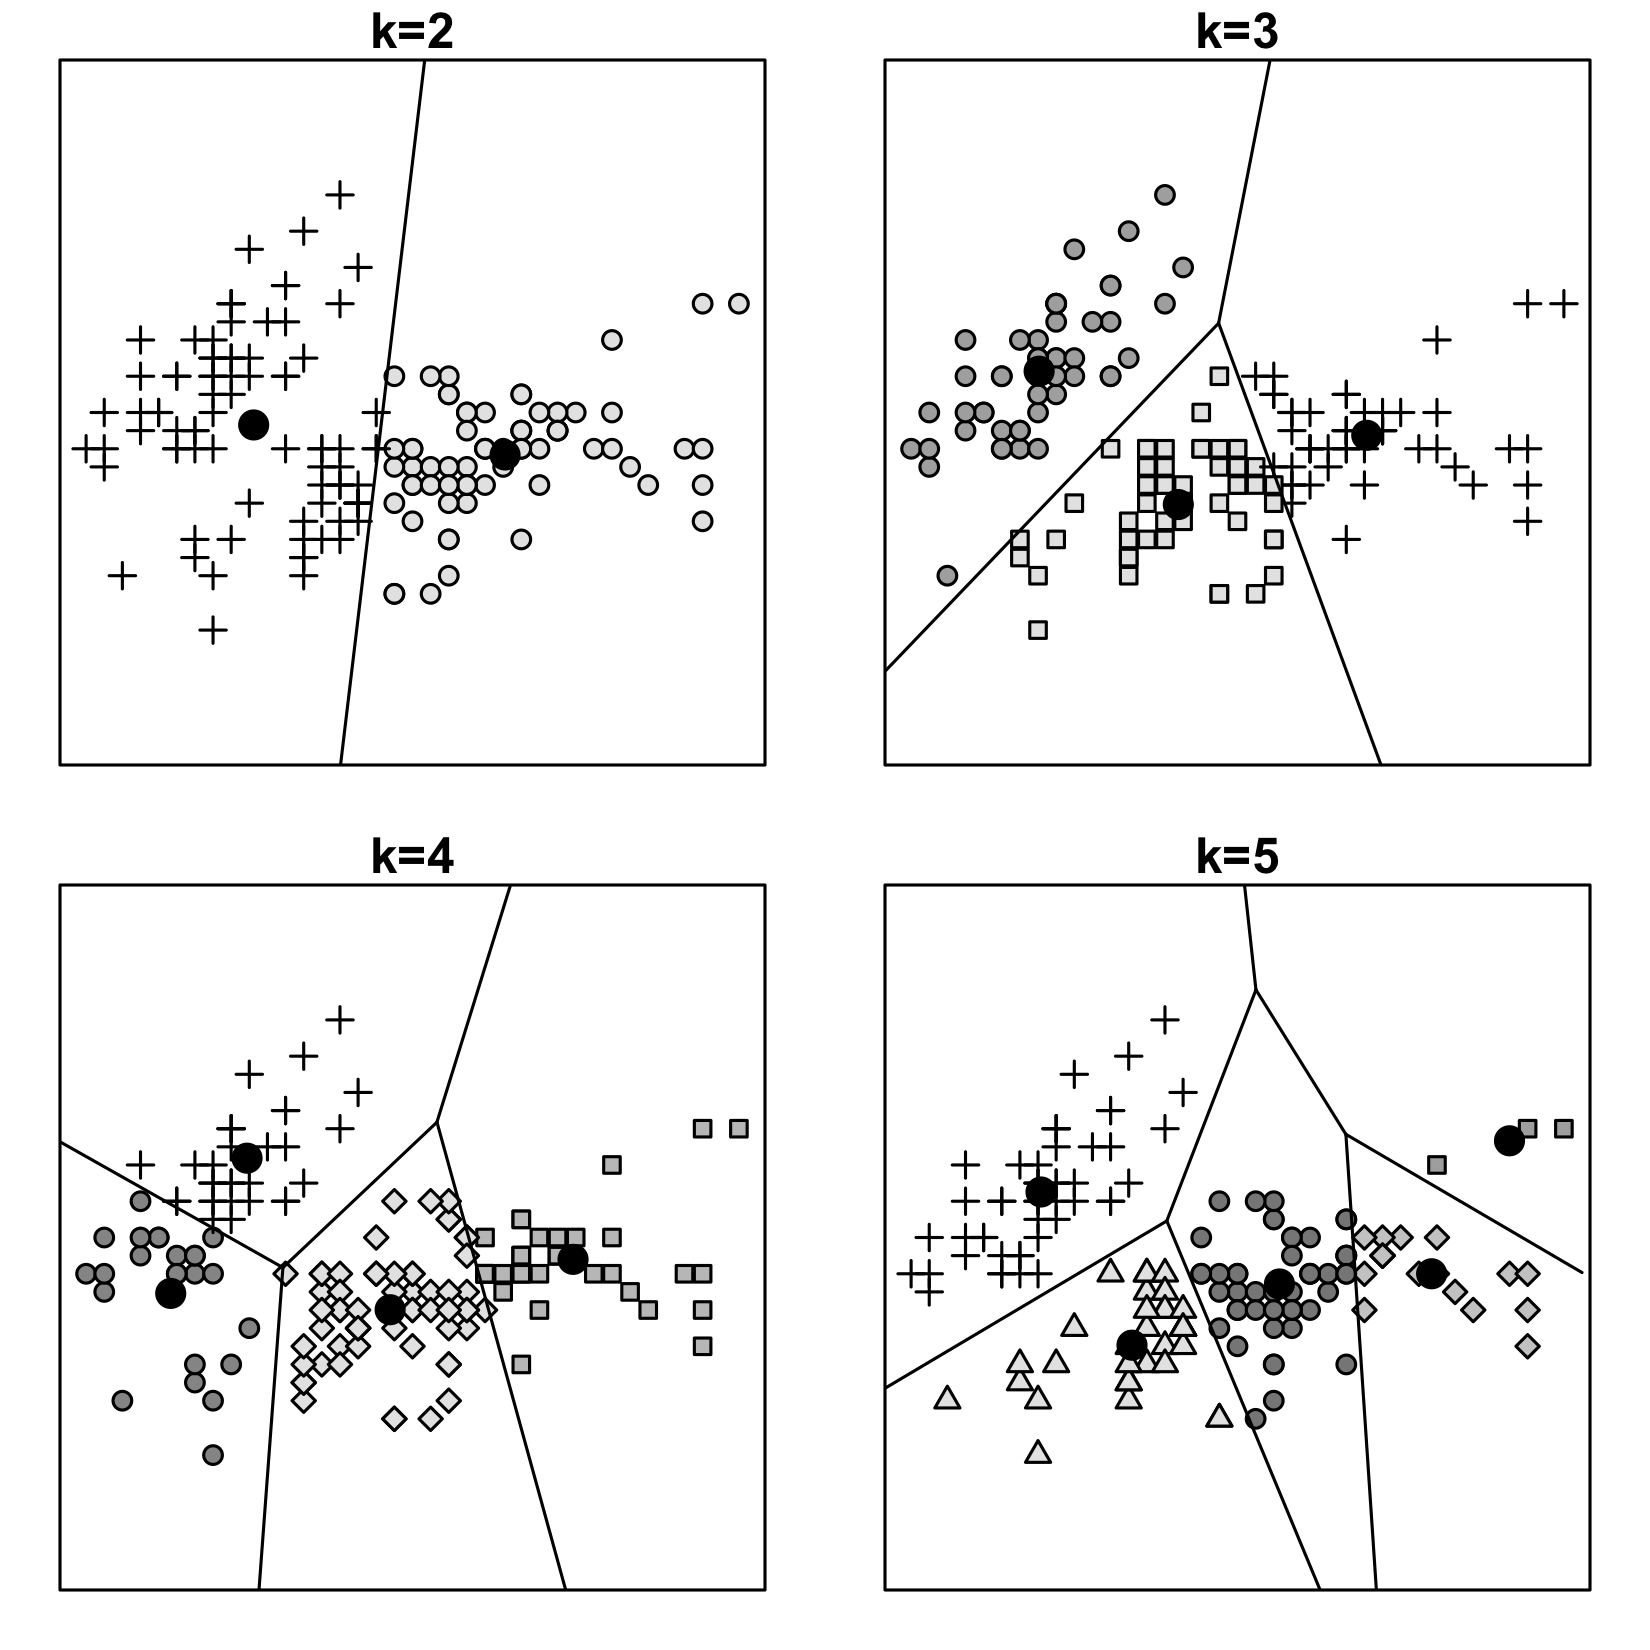
  • How to choose the number of clusters

Unsupervised learning


Unsupervised learning is a way of making hidden patterns in data visible:

  • Clustering finds groups or hierarchy of similar objects
  • Unsupervised anomaly detection finds outliers (weird samples)
  • Dimensionality reduction finds which details of data are the most important
  • Factor analysis reveals the latent variables that influence the behavior of the observed variables
  • Rule mining finds associations between different entities in the data

As usually, these tasks overlap pretty often, and many practical problems inhabit the neutral territory between supervised and unsupervised learning.

We will focus on clustering in this chapter and on rule mining in the next chapter. Others will remain mostly beyond the scope of this book, but in Chapter 10Natural Language Processing, we will nevertheless briefly discuss autoencoders; they can be used for both dimensionality reduction and anomaly detection.

Here are some examples of real-world tasks where clustering would be your tool of choice...

K-means clustering


The name of this algorithm comes from the k clusters into which the samples are divided, and the fact that each cluster is grouped around some mean value, a centroid of a cluster. This centroid serves as a prototype of a class. Each data point belongs to the cluster which centroid is the closest.

The algorithm was invented in 1957 at Bell Labs.

In this algorithm, each data point belongs to only one cluster. As a result of this algorithm, we get the feature space partitioned into Voronoi cells.

Note

Because of the k in its name, this algorithm is often confused with the KNN algorithm, but as we already have seen with k-fold cross-validation, not all ks are the same. You may wonder why machine learning people are so obsessed with this letter that they put it in every algorithm's name. I don't k-now.

Figure 4.1: Four different ways to cluster the same data using k-means algorithm. Bald black dots are centroids of clusters. The samples are from the classical Iris dataset, plotted...

Implementing k-means in Swift


Similar to the KNN from the previous chapter, we'll have a structure to represent an algorithm and keep all its hyperparameters:

struct KMeans { 
  public let k: Int 

The standard k-means algorithm was designed to be used only with Euclidean distance:

internal let distanceMetric = Euclidean.distance 

We need several arrays to store different kinds of data during the clustering.

Storage for samples:

internal var data: [[Double]] = [] 

Coordinates of centroids:

public var centroids: [[Double]] = [] 

An array that matches each sample to its cluster. It should be of the same length as the data, and for every sample, it stores an index of centroid in the centroids array:

private(set) var clusters: [Int] = [] 

Within-cluster sum of squares is a measure that we'll use later to assess the quality of the result:

internal var WCSS: Double = 0.0 

For now, the only parameter that we pass on the initialization is the number of clusters:

public init (k: Int) { 
  self.k = k 
}
} 

Unlike...

Clustering objects on a map


Where can we apply k-means in the context of mobile development? Clustering pins on a map may look like the most natural idea. Having the clusters of user locations, you can guess the location of the user's important locations like home and workplace, for example. We will implement pin clustering to visualize k-means, some of its unfortunate properties, and show why such an application of it may be not the best idea.

You can find a demo application under the 4_kmeans/MapKMeans folder of supplementary code. Everything interesting happens in the ViewController.swift. Clustering happens in the clusterize() method:

func clusterize() { 
  let k = Settings.k 
  colors = (0..<k).map{_ in Random.Uniform.randomColor()} 
  let data = savedAnnotations.map{ [Double]($0.coordinate) } 
  var kMeans = KMeans(k: k) 
  clusters = kMeans.train(data: data) 
  centroidAnnotations = kMeans.centroids 
    .map { CLLocationCoordinate2D(latitude: $0[0], longitude: $0[1]) } 
    .map...

Choosing the number of clusters


If you don't know in advance how many clusters you have, then how do you choose the optimal k? This is essentially an egg-and-chicken problem. Several approaches are popular and we'll discuss one of them: the elbow method.

Do you remember those mysterious WCSS that we calculated on every iteration of k-means? This measure tells us how much points in every cluster are different from their centroid. We can calculate it for several different k values and plot the result. It usually looks somewhat similar to the plot on the following graph:

Figure 4.3: WCSS plotted against the number of clusters

This plot should remind you about the similar plots of loss functions from Chapter 3K-Nearest Neighbors Classifier. It shows how well our model fits the data. The idea of the elbow method is to choose the k value after which the result is not going to improve sharply anymore. The name comes from the similarity of the plot to an arm. We choose the point at the elbow, marked...

K-means clustering – problems


Refer to the following for more information about k-means and k-means++:

K-means algorithm suffers from at least two shortcomings:

  • The worst-case time complexity of the algorithm is super polynomial in the input size, meaning that it is not bounded above by any polynomial
  • Standard algorithm can perform arbitrarily poor in comparison to the optimal clustering because it finds only an approximation of the real optimum

Try it out yourself: put four pins on a map, as shown in the following image. After running clustering several times, you may notice that the algorithm often converges to the suboptimal solution:

Figure 4.4: Optimal and non-optimal clustering results on the same dataset

K-means++


An improved algorithm was proposed in 2007. K-means++ addresses the problem of suboptimal clustering by introducing an additional step for a good centroids initialization.

An improved algorithm of initial centers selection looks like this:

  1. Select randomly any data point to be the first center
  2. For all other data points, calculate the distance to the first center d(x)
  3. Sample the next center from the weighted probability distribution, where the probability of each data point to become a next center is proportional to the square of distance d(x)2
  4. Until k centers are chosen, repeat step 2 and step 3
  5. Proceed with the standard k-means algorithm

In Swift, it looks like this:

internal mutating func chooseCentroids() { 
  let n = data.count 
 
  var minDistances = [Double](repeating: Double.infinity, count: n) 
  var centerIndices = [Int]() 

clusterID is an integer identifier of a cluster: the first cluster has identifier zero, the second has one, and so on:

for clusterID in 0 ..< k { 
  var pointIndex...

Image segmentation using k-means


The k-means algorithm was invented in the field of digital signal processing and is still in common use in that field for signal quantization. For this task, it performs much better than for pin clustering. Let's look at an example on the following diagram. The picture can be segmented into meaningful parts using color space quantization. We choose the number of clusters, then run k-means on every pixel's RGB values, and find the cluster's centroids. Then we replace each pixel with the color of its corresponding centroid. This can be used in image editing for separating objects from the background or for lossy image compression. In Chapter 12Optimizing Neural Networks for Mobile Devices, we're going to use this approach for deep learning neural network compression:

Figure 4.5: Image segmentation using k-means


Here is a code sample in Objective-C++ using fast OpenCV implementation of k-means. You can find the whole iOS application in the folder 4_kmeans/ImageSegmentation...

Summary


In this chapter, we've discussed an important unsupervised learning task: clustering. The simplest clustering algorithm is k-means. It doesn't provide stable results and is computationally complex, but this can be improved using k-means++. The algorithm can be applied to any data for which Euclidean distance is a meaningful measure, but the best area to apply it is a signal quantization. For instance, we've used it for image segmentation. Many more clustering algorithms exist for different types of tasks.

In the next chapter, we're going to explore unsupervised learning more deeply. Specifically, we're going to talk about algorithms for finding association rules in data: association learning.


lock icon
The rest of the chapter is locked
You have been reading a chapter from
Machine Learning with Swift
Published in: Feb 2018Publisher: PacktISBN-13: 9781787121515
Register for a free Packt account to unlock a world of extra content!
A free Packt account unlocks extra newsletters, articles, discounted offers, and much more. Start advancing your knowledge today.
undefined
Unlock this book and the full library FREE for 7 days
Get unlimited access to 7000+ expert-authored eBooks and videos courses covering every tech area you can think of
Renews at $15.99/month. Cancel anytime

Authors (3)

author image
Jojo Moolayil

Jojo Moolayil is a data scientist, living in Bengaluru—the silicon valley of India. With over 4 years of industrial experience in Decision Science and IoT, he has worked with industry leaders on high impact and critical projects across multiple verticals. He is currently associated with GE, the pioneer and leader in data science for Industrial IoT. Jojo was born and raised in Pune, India and graduated from University of Pune with a major in information technology engineering. With a vision to solve problems at scale, Jojo found solace in decision science and learnt to solve a variety of problems across multiple industry verticals early in his career. He started his career with Mu Sigma Inc., the world's largest pure play analytics provider where he worked with the leaders of many fortune 50 clients. With the passion to solve increasingly complex problems, Jojo touch based with Internet of Things and found deep interest in the very promising area of consumer and industrial IoT. One of the early enthusiasts to venture into IoT analytics, Jojo converged his learnings from decision science to bring the problem solving frameworks and his learnings from data and decision science to IoT. To cement his foundations in industrial IoT and scale the impact of the problem solving experiments, he joined a fast growing IoT Analytics startup called Flutura based in Bangalore and headquartered in the valley. Flutura focuses exclusively on Industrial IoT and specializes in analytics for M2M data. It is with Flutura, where Jojo reinforced his problem solving skills for M2M and Industrial IoT while working for the world's leading manufacturing giant and lighting solutions providers. His quest for solving problems at scale brought the 'product' dimension in him naturally and soon he also ventured into developing data science products and platforms. After a short stint with Flutura, Jojo moved on to work with the leaders of Industrial IoT, that is, G.E. in Bangalore, where he focused on solving decision science problems for Industrial IoT use cases. As a part of his role in GE, Jojo also focuses on developing data science and decision science products and platforms for Industrial IoT.
Read more about Jojo Moolayil

author image
Alexander Sosnovshchenko

Alexander Sosnovshchenko has been working as an iOS software engineer since 2012. Later he made his foray into data science, from the first experiments with mobile machine learning in 2014, to complex deep learning solutions for detecting anomalies in video surveillance data. He lives in Lviv, Ukraine, and has a wife and a daughter.
Read more about Alexander Sosnovshchenko